When hurricanes and other dangerous weather events happen, weather forecasters warn people of the potential danger. Fortunately, we also have access to many of the images and data that meteorologists, public officials, and emergency managers rely on to make decisions.
For example, in September 2019, Dorian, a Category 5 hurricane, stalled over the Bahamas, then moved up the coast of the United States. Then Humberto started near the Lesser Antilles and came into radar view again near the Bermudas after growing to a Category 3 hurricane. And one of the tropical depressions in the Gulf of Mexico developed into Imelda, shortly before making landfall in Texas. Another tropical storm Jerry, which formed in Atlantic, strengthened into a hurricane near the Leeward Islands.
Here’s how to follow the path of storms with the help of tools such as satellites, radar, and observation equipment.
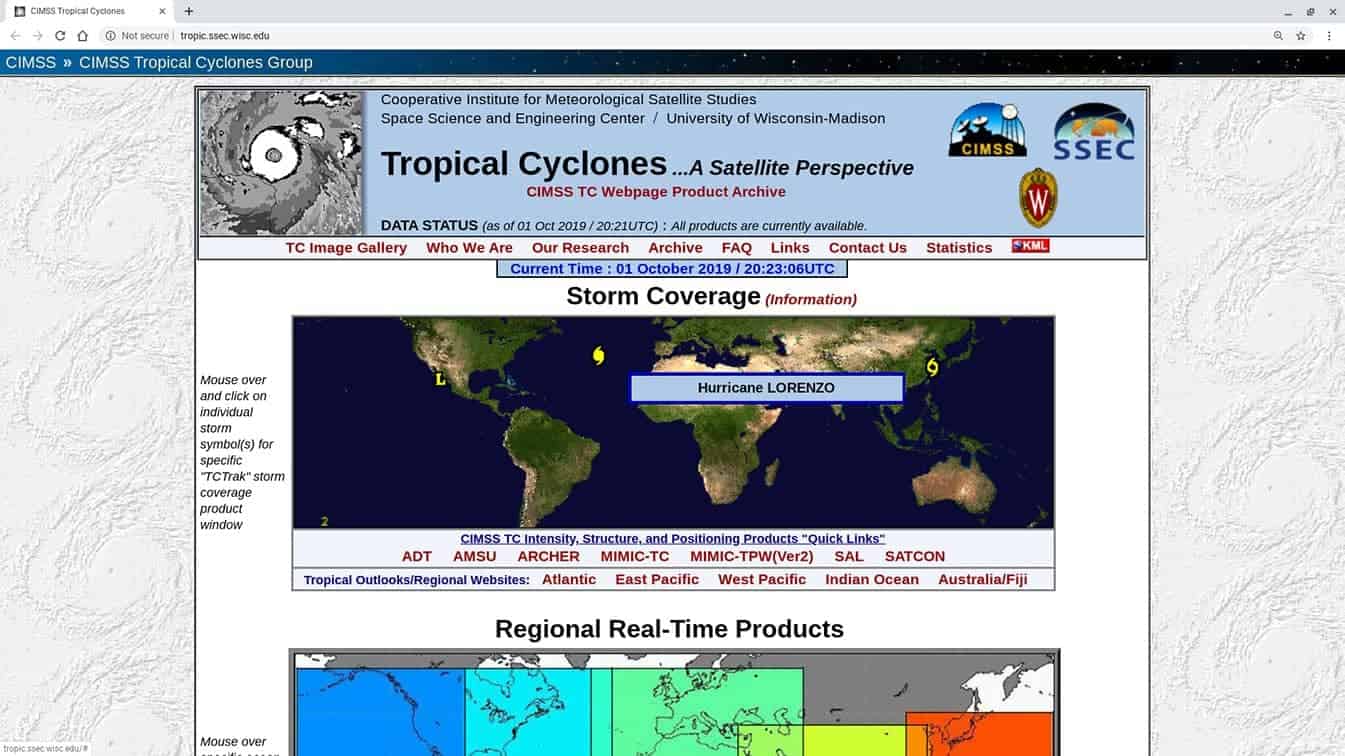
Satellites
Since satellites are positioned further from earth than storm clouds, a satellite’s sensors can detect storm systems. This can be especially helpful for storms that form over oceans or in regions where other methods of detection aren’t available.
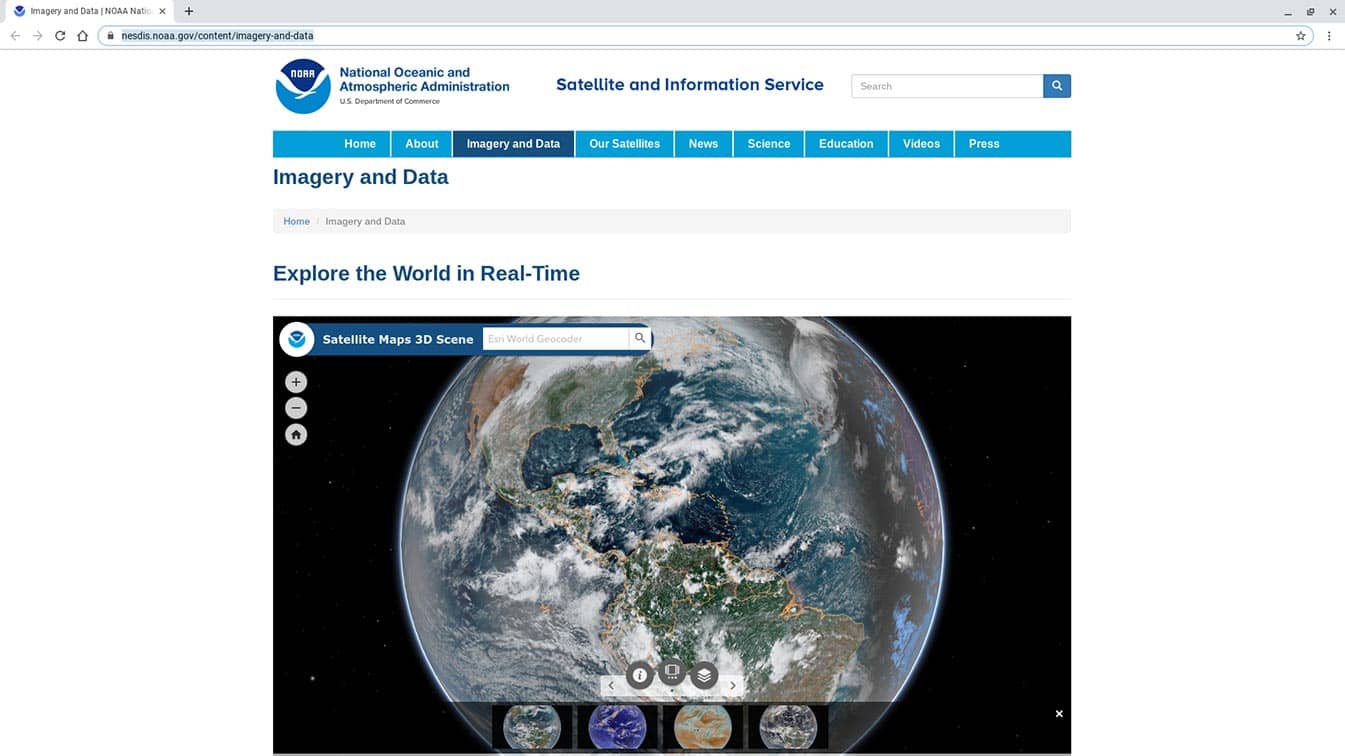
Weather satellites often display either black-and-white or artificially-colored images. During daylight, a satellite image of a storm might typically show white clouds contrasted against the darker background of a body of water or land. Satellite sensors also detect data not visible to the human eye, such as infrared imaging.
Satellite views provide early indications of potential precipitation.
Radar
Radar displays images based on reflectivity of storms as they move into range. Modern radar can detect reflectivity at a range of up to more than 280 miles, although greater resolution is available when a system is within about 140 miles of a radar site. Airport radar equipment often has less range.
RainViewer displays reflectivity, both for a single radar site or in a mosaic view. In RainViewer on Android or iOS, tap the radar icon to view — and then select with a tap — a single radar side. Tap the radar icon again to return to mosaic view, which combines data from multiple radar sites into a unified view.
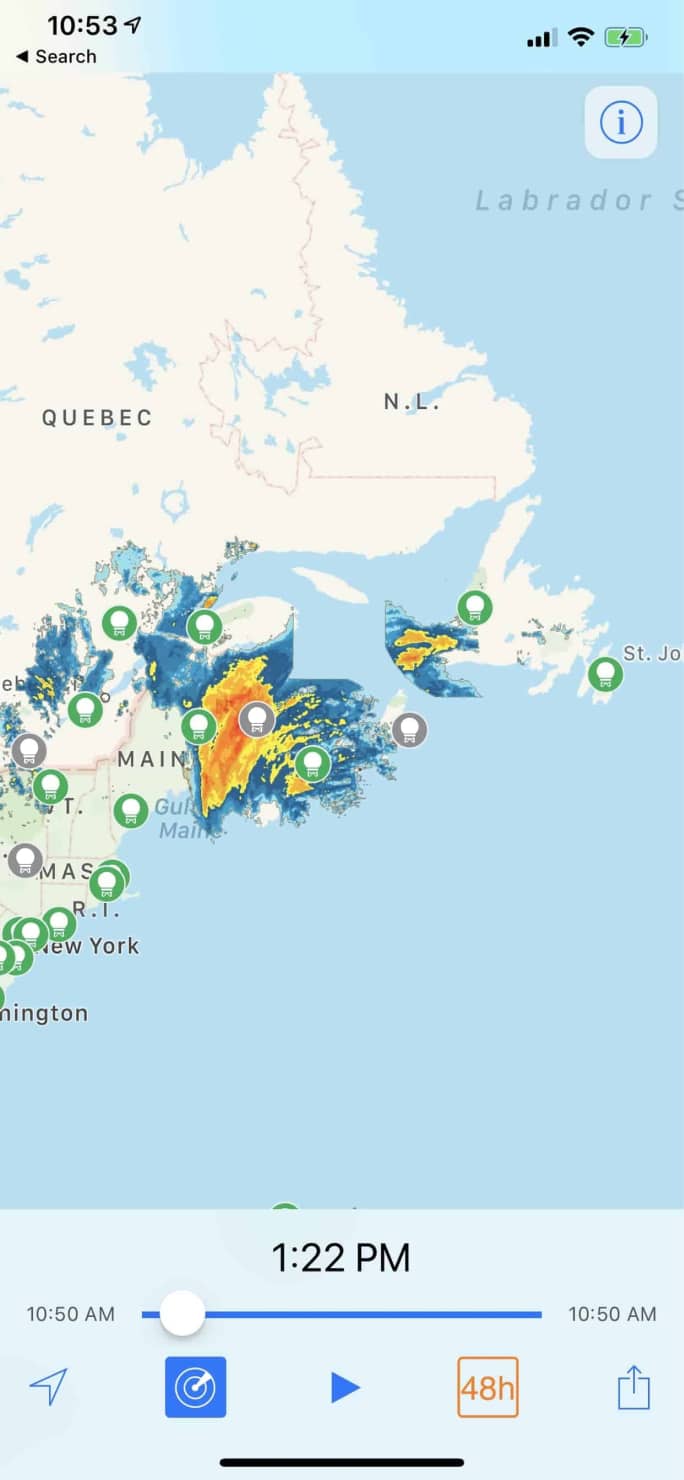
When a storm moves near radar, you can see the scope of the storm on RainViewer. As Imelda moved near the Texas coast, as Faxai approached Japan, and as Humberto closed in on Bermuda, RainViewer showed people the huge portion of each storm within radar range.
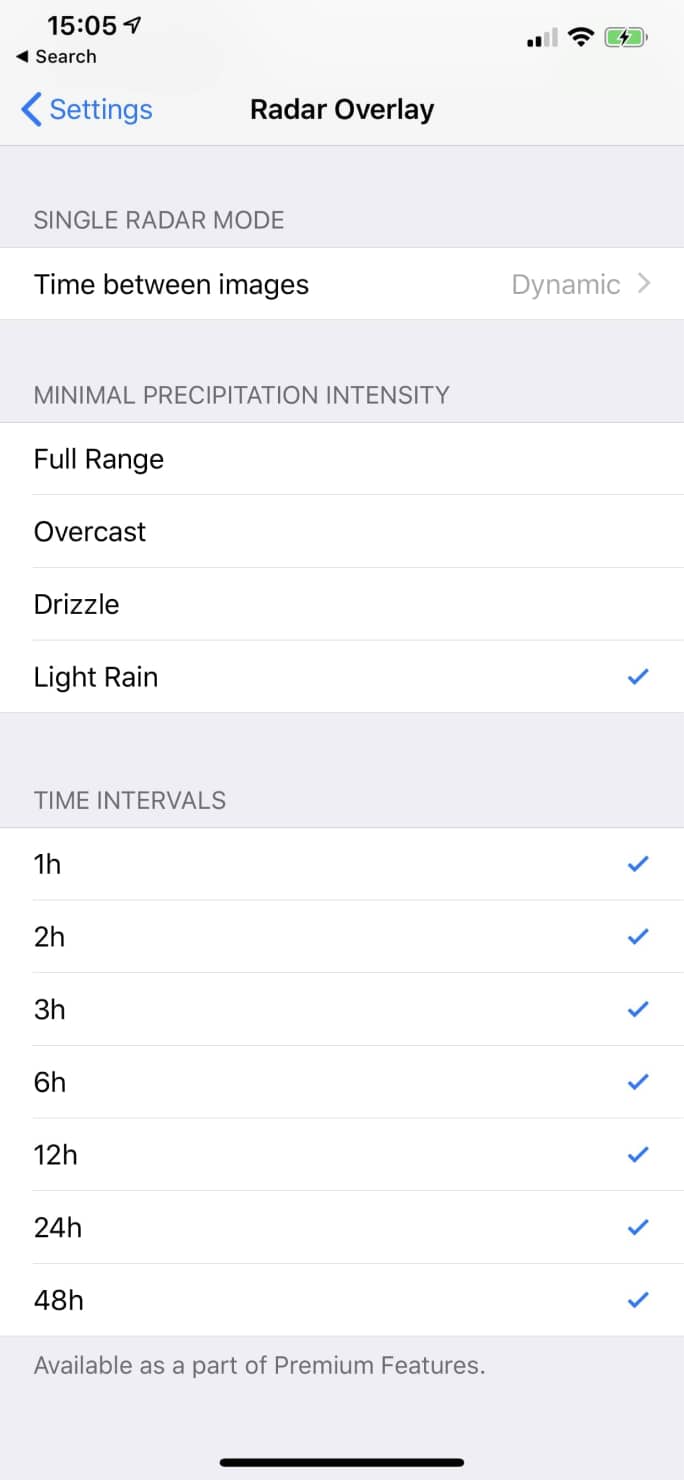
You also may adjust how RainViewer displays reflected precipitation. Radar sometimes detects precipitation that is very light — or so light that it doesn’t even reach the ground. Tap the circle with an “i” in it to access settings, and in the “Radar Overlay” section tap “More…”, then look for “Minimal Precipitation Intensity”. Full Range is selected by default, but you may adjust it to Overcast, Drizzle, or Light Rain. Experiment with the different settings, then look at the RainViewer image. These can help give you a better understanding of the full-scale of a storm.
Observations on land and sea
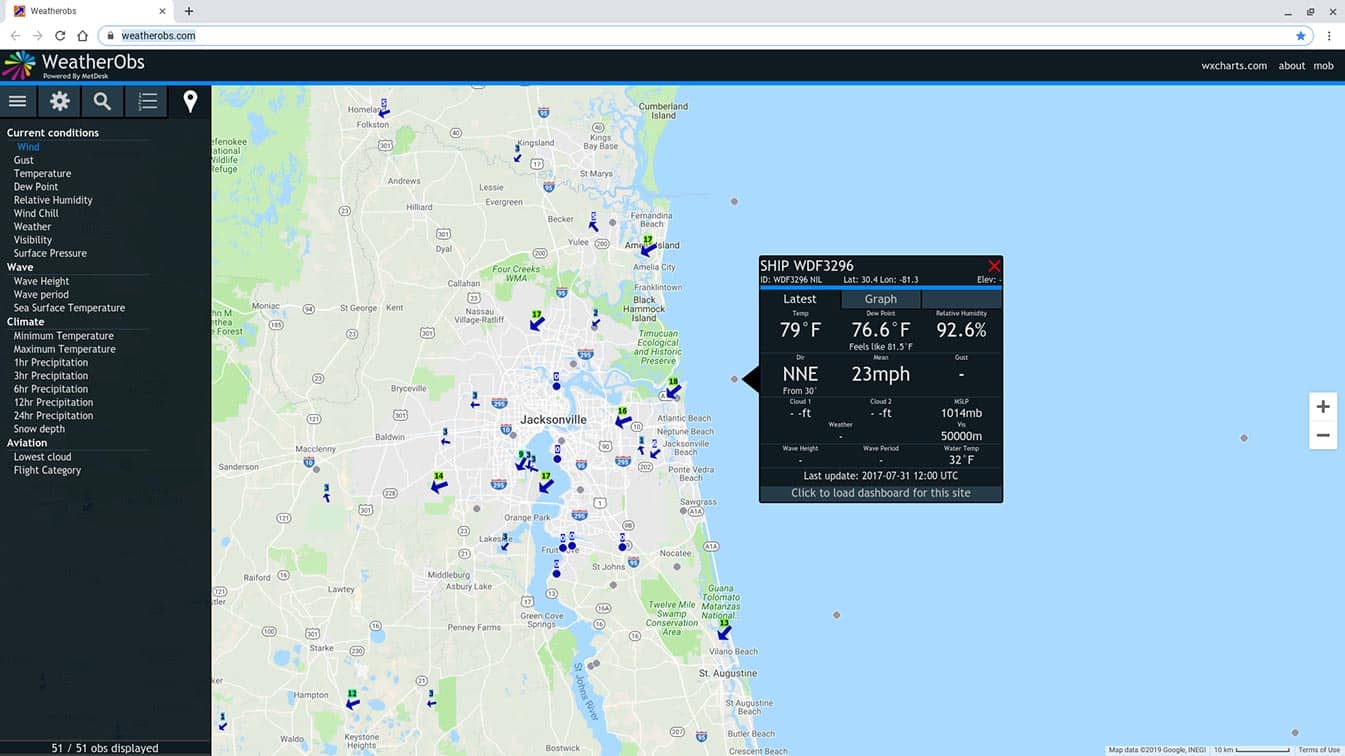
As a storm system moves closer to land, it also moves closer to devices that measure temperature, wind speed, and air pressure. These observation systems include automated systems on land, buoys at sea, along with measurements taken by both professional and amateur observers’ equipment. When combined with satellite and radar images, data from these observation sites can give you a fairly good sense of the scope of a storm.
While there are many ways to access this data, WeatherObs.com offers a relatively simple-to-access and explore site. (In the site settings, turn “Show Amateur Stations” to “Yes” to view the greatest number of observation sites.) Zoom in near a storm that you’ve identified from satellite or radar images, and select a dot to access data for that observation device. The site also displays data for weather devices on ships.
Dropsonde
During some storms, specialized aircraft fly routes designed to measure the scale, intensity, and path of the system. These planes also often release a dropsonde, a device dropped from the aircraft and designed to measure temperature, air pressure, and humidity. Much as a device attached to a weather balloon provides this data when launched from a weather station, this device delivers this data dropped from above.
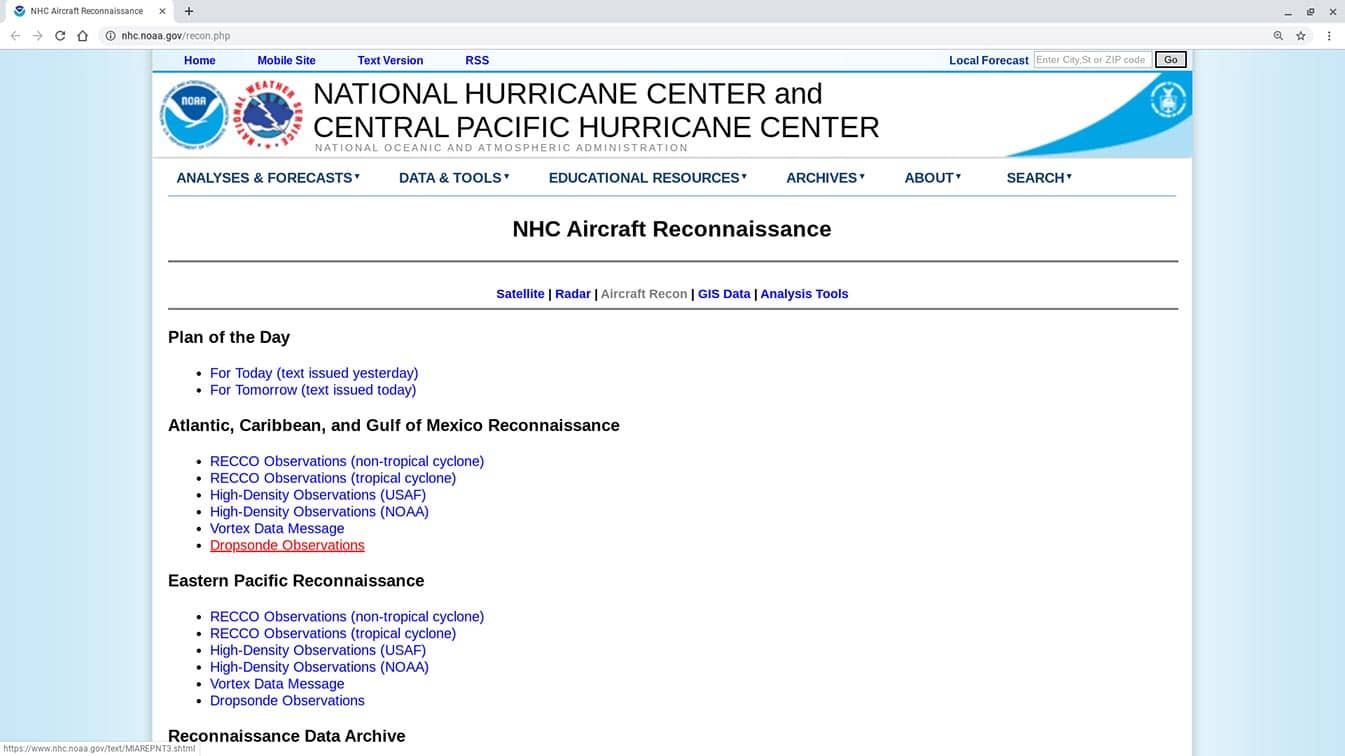
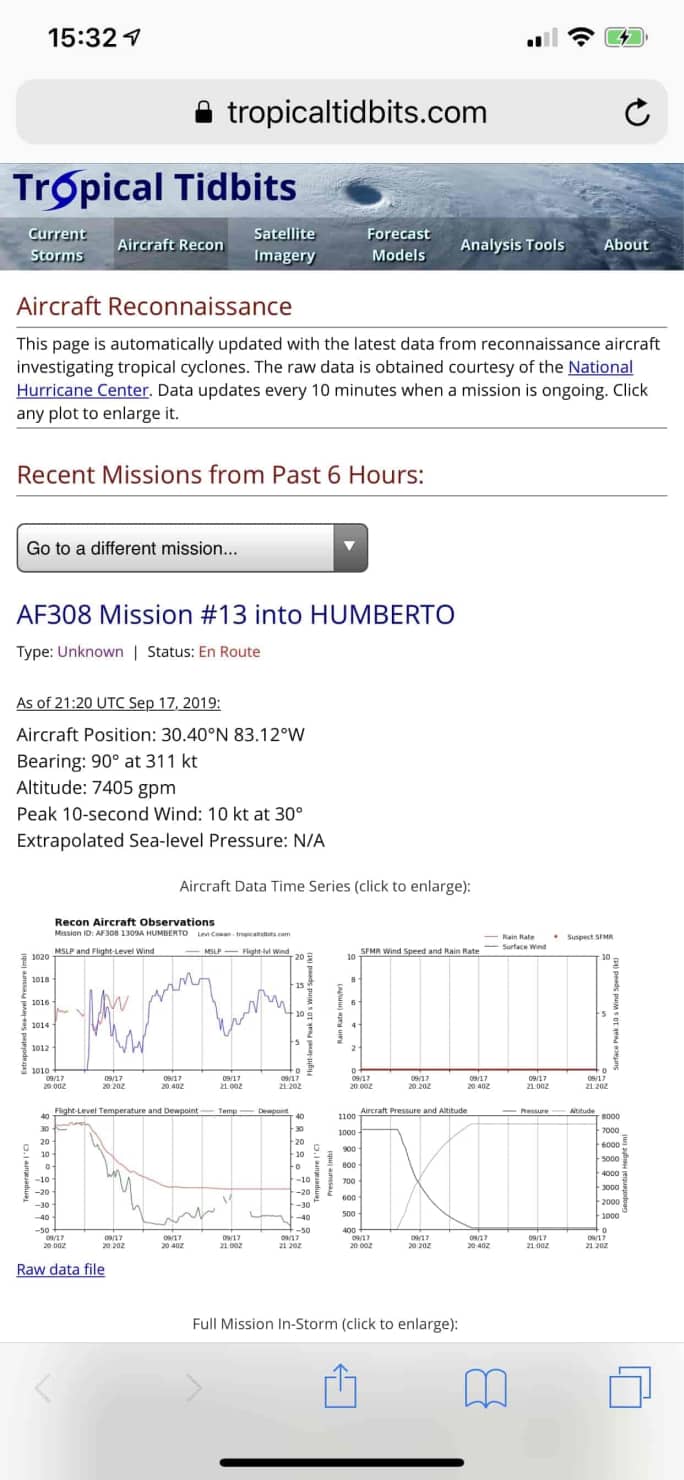
In the U.S., dropsonde data is available from the National Hurricane Center, as well as some third-party sites, such as Tropical Tidbits help make the data easier for people to understand.