
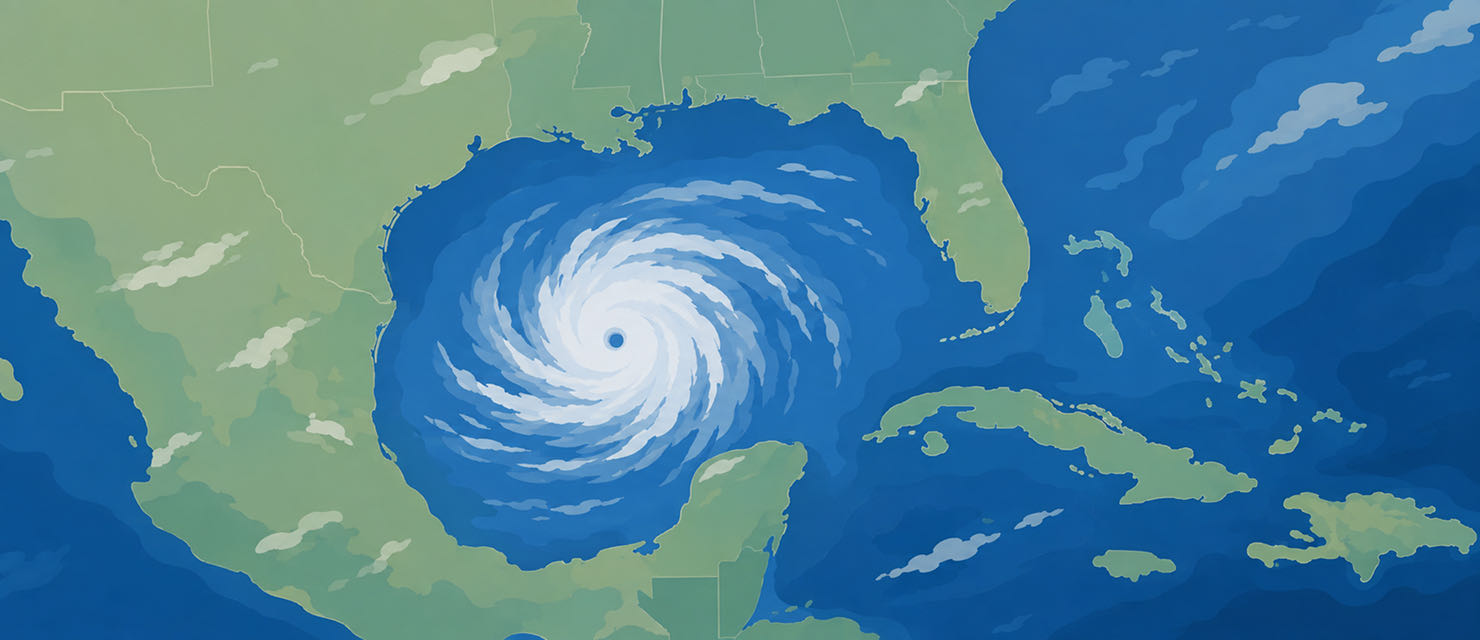
For the 2026 hurricane season, Mexico’s Servicio Meteorologico Nacional forecast 18 to 21 named storms in the Pacific. NOAA forecast 15 to 22 for the same basin. The ranges differ because each centre weights the variables differently.
Who issues the seasonal forecasts
Four sources publish numbers for 2026. Colorado State University and Tropical Storm Risk published their Atlantic forecasts on 9 April. The Servicio Meteorologico Nacional published its own on 22 April. NOAA’s Climate Prediction Center published its own on 21 May.
The Colorado State project began with William Gray in 1984. His first forecast was for that year’s season.
Which variables they use
The Climate Prediction Center considers four factors: the El Nino-Southern Oscillation (ENSO), a tropical cycle of 25 to 40 years, wind shear over the oceans, and sea surface temperature. Gray’s original method used ENSO, the quasi-biennial oscillation, and sea level pressure in the Caribbean.
Two of those variables weigh more than the others. Vertical wind shear is the change in wind speed or direction between the surface and the upper atmosphere. Strong shear tears developing cyclones apart. Sea surface temperature of 26.5 °C (80 °F) or higher supplies the energy that lets them form.
El Nino is the factor that separates the two basins in 2026. NOAA cited its expected development as the reason for forecasting an above-normal season in the eastern Pacific and as a suppressing factor in the Atlantic.
What the sources forecast for 2026
| Basin | Source | Date | Named storms | Hurricanes | Major hurricanes |
|---|---|---|---|---|---|
| Pacific | NOAA | 21 May | 15 to 22 | 9 to 14 | 5 to 9 |
| Pacific | SMN | 22 April | 18 to 21 | 9 to 11 | 4 to 5 |
| Atlantic | NOAA | 21 May | 8 to 14 | 3 to 6 | 1 to 3 |
| Atlantic | Colorado State | 9 April | 13 | 6 | 2 |
| Atlantic | Tropical Storm Risk | 9 April | 12 | 5 | 1 |
Colorado State and Tropical Storm Risk also publish the ACE index (Accumulated Cyclone Energy). ACE sums the square of the maximum sustained winds of every named storm, measured every six hours. It measures how much energy a season accumulates, not only how many storms it holds. For 2026, Colorado State projected 90 units and Tropical Storm Risk projected 66.
Seasonal forecasts estimate how many storms will form across six months from El Nino, sea surface temperature and wind shear, and they include neither tracks nor landfall points.
What a seasonal forecast cannot say
Gray found inconsistent results when a single factor was the main influence. He then developed forecasts that estimate only the number of tropical storms, hurricanes and major hurricanes, with no tracks and no landfall points. Today’s centres keep that same scope.
A season forecast does not point at individual storms. Hurricane Otis made landfall west of Acapulco on 25 October 2023 as a Category 5, with winds of 260 km/h (160 mph). No seasonal number can say when or where a system like that forms.
How to compare forecast models in RainViewer
A seasonal forecast is combined with live data. The RainViewer Forecast 72h layer switches between the ICON, GFS and ECMWF models so the expected rain over the next 72 hours can be compared side by side. Each model has a different resolution. GFS covers the whole world, refreshes four times a day and is useful for comparing trends in large systems. ECMWF, at 9 km (5.6 miles) resolution, is the strongest beyond 24 hours.
RainViewer includes the Forecast 72h layer with the ICON, GFS and ECMWF models, and lets you switch between them to compare the rain expected up to 72 hours ahead.
From the season forecast to this week’s
A seasonal forecast states the expected size of six months. The decision about one particular week comes from the analysis of one particular system: its position, its movement and what the models show.



 RainViewer
