

Between August and October, the Atlantic produces 78% of its tropical storm days, 87% of its Category 1 and 2 hurricane days, and 96% of its major hurricane days. Those figures come from NOAA’s Hurricane Research Division. They explain why peak hurricane season is centered on a single date: September 10.
When is peak hurricane season?
The Atlantic hurricane season runs from June 1 to November 30. Activity climbs through August, peaks from late August into September, and falls through October. September 10 is the statistical midpoint of that peak.
The June 1 to November 30 window was set in 1965 to cover more than 97% of Atlantic tropical cyclone activity. The peak sits well inside it.
Why activity crests in early September
Tropical cyclones need sea surface temperatures of about 26.5 °C (80 °F) or warmer. The tropical Atlantic absorbs heat all summer, and its water is at its warmest in late summer. That warm water is the fuel.
Vertical wind shear is the second condition. Wind shear is the change in wind speed or direction between the surface and the upper atmosphere. Strong shear tears developing storms apart. In early September, shear over the tropical Atlantic is usually weaker than earlier in summer, so storms keep their structure.
The third condition is supply. Many of the strongest Atlantic hurricanes begin as tropical waves, clusters of thunderstorms that move west off the coast of Africa. That stream of disturbances is busiest in late summer.
From August through October, the Atlantic records 96% of its major hurricane days.
The peak is an average, not a schedule
September 10 comes from decades of records. A single season can peak earlier, later, or barely at all.
El Niño, a warming of the central and eastern Pacific, raises wind shear over the Atlantic and suppresses storm formation. NOAA’s May 21, 2026 outlook cited expected El Niño development and called for 8 to 14 named storms, 3 to 6 hurricanes, and 1 to 3 major hurricanes. Colorado State University’s April 9 forecast was 13 named storms, 6 hurricanes, and 2 major hurricanes.
A quiet outlook does not remove the risk from one storm. An outlook counts storms across six months. It does not say where any of them will make landfall.
Storms also form outside the peak
The official dates cover more than 97% of activity, so a small share falls outside them. Storms have formed in January and December. Read when hurricane season actually ends for the record of those off-season storms.
What to check around the peak
Around September 10, check three things for every place you care about: whether a tropical storm has formed nearby, what the forecast models show for expected rain over the next 3 days, and which official warnings are active.
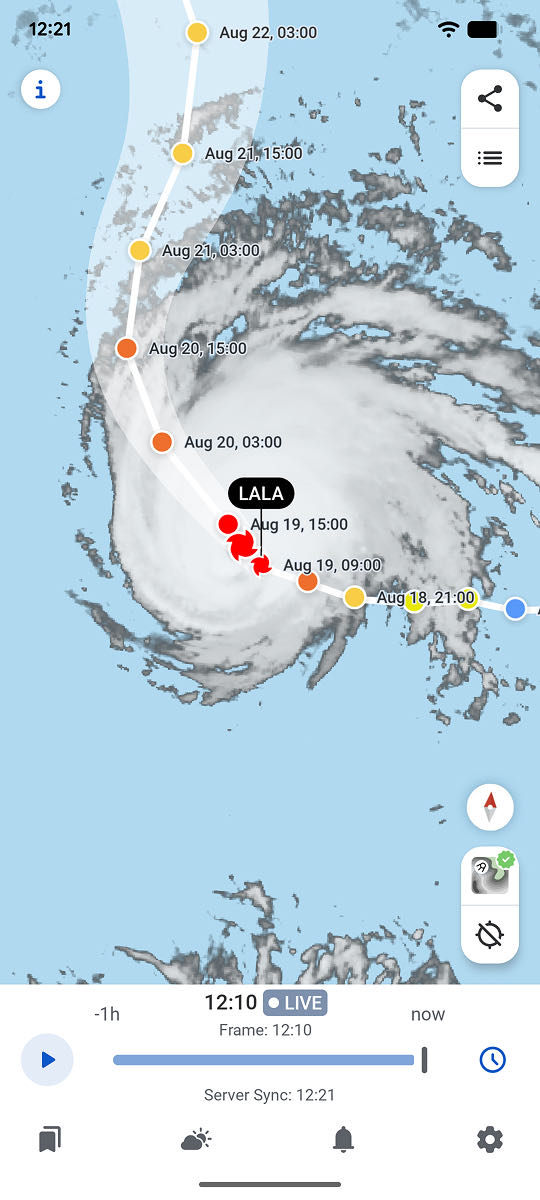
RainViewer shows radar, satellite, and Forecast 72h on one map. Forecast 72h switches between the ICON, GFS, and ECMWF models, so the expected rain from each model can be compared side by side.
RainViewer alerts users when a tropical storm forms nearby, timed to when the storm is expected to reach their saved location.
A date is not a forecast
September 10 marks the middle of the busiest weeks of the year. The risk for any coastline depends on the storm that exists that week, and RainViewer shows what that storm is doing now.



 RainViewer
