
Os Totais de chuva mostram quanta chuva realmente caiu em qualquer ponto do mapa — nas últimas 1, 3, 12, 24 ou 48 horas, medida pelo radar meteorológico. Não é uma previsão nem uma estimativa por satélite; o nome meteorológico para esse tipo de dado é QPE, ou Estimativa Quantitativa de Precipitação (Quantitative Precipitation Estimation). Se você já quis saber se a tempestade de ontem à noite despejou 5 mm ou 50 mm na sua rua, abra Camadas do Mapa e toque em Totais de chuva (QPE) em Ferramentas Estendidas.
O que os Totais de chuva (QPE) realmente medem
Os Totais de chuva mostram a chuva acumulada ao longo de uma janela de tempo móvel, calculada a partir do feed do radar meteorológico ao vivo — a mesma fonte que você já usa na camada normal de precipitação do RainViewer. Cada varredura do radar é convertida em uma taxa de chuva por pixel em milímetros, e essas taxas são então somadas dentro da janela escolhida. O resultado é um mapa de calor de quanta chuva atingiu o solo em cada local.
Duas coisas que ele não é. Não é uma previsão — não há nenhum modelo prevendo chuva futura nesta camada. Também não é uma estimativa por satélite que infere a chuva a partir da temperatura do topo das nuvens. O QPE é uma medição direta feita por radares meteorológicos terrestres, a mesma família de dados que o National Weather Service publica para os EUA como Stage IV QPE.
Se você ainda não conhece bem o funcionamento do radar meteorológico, nossa introdução à leitura de imagens de radar meteorológico é um bom ponto de partida.
Onde encontrá-lo no RainViewer
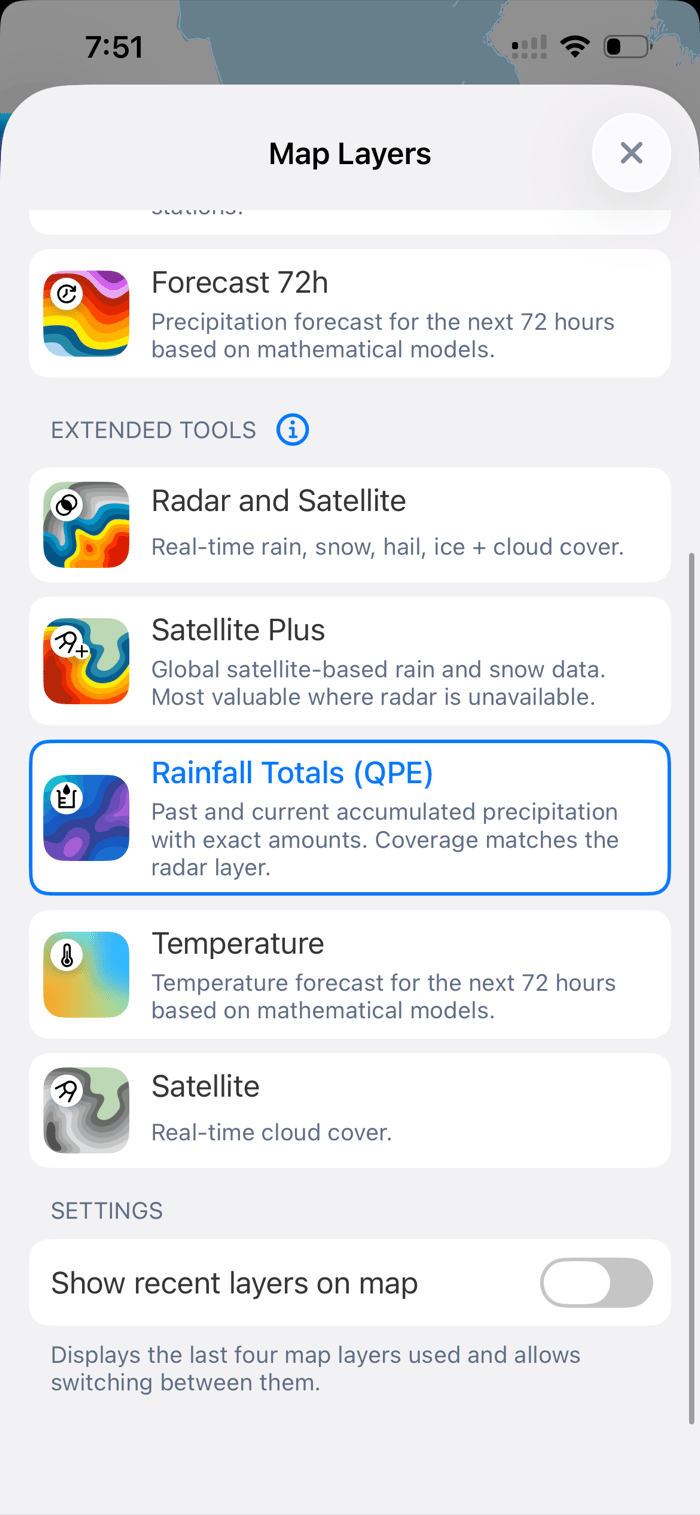
Abra o painel Camadas do Mapa pelo ícone de camadas no canto inferior direito do mapa. Role para baixo até a seção Ferramentas Estendidas e toque em Totais de chuva (QPE). Ele fica logo ao lado de Radar e Satélite e Satélite Plus, com um ícone roxo-rosa que dá uma ideia da escala de cores que você verá no mapa.
Escolha uma janela: 1h, 3h, 12h, 24h ou 48h
Cada janela de tempo é uma janela móvel que termina na varredura de radar mais recente, não um período fixo do relógio. Se você tocar em 24h às 19h de hoje, o mapa mostrará tudo o que caiu desde as 19h de ontem. Janelas mais curtas destacam células de tempestade individuais; janelas mais longas mostram quanta chuva um evento de vários dias inteiro produziu.
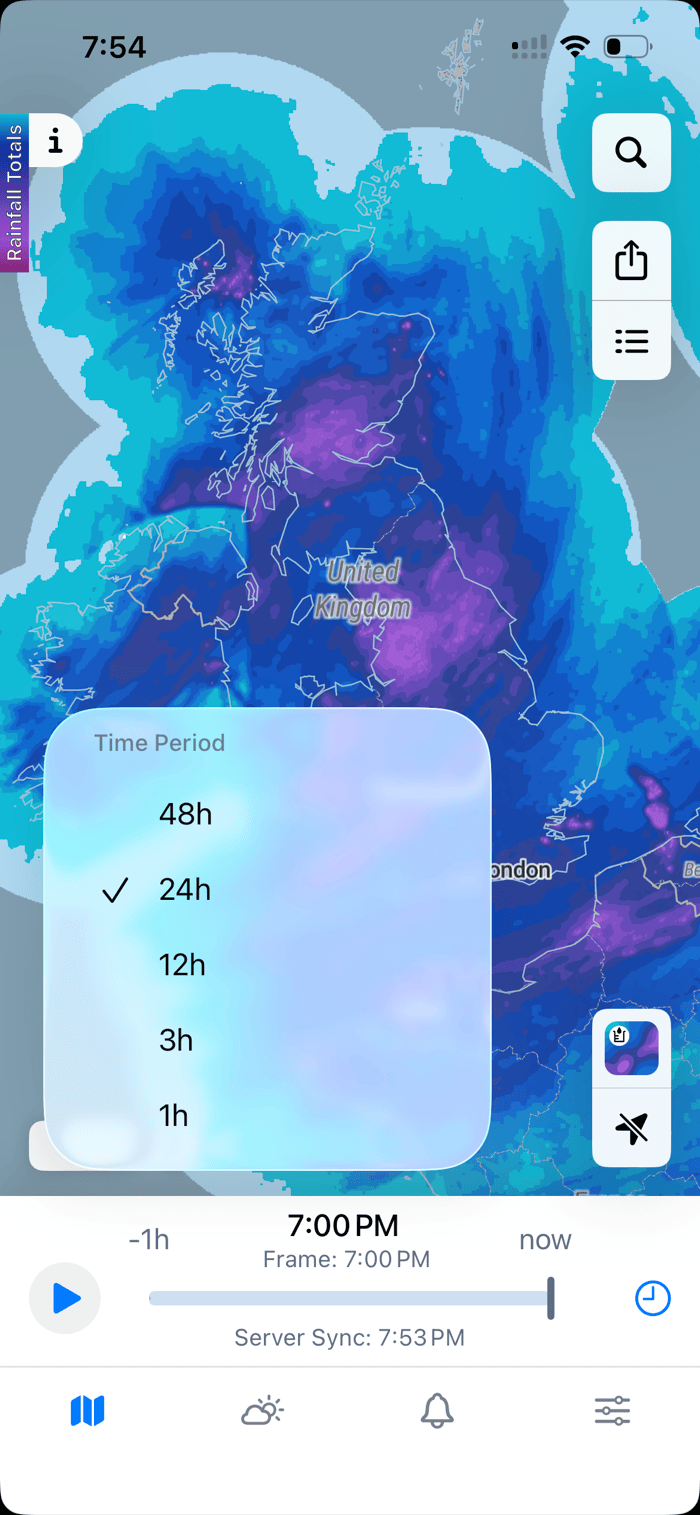
O botão de janela fica no canto inferior esquerdo do mapa. Altere-o quantas vezes quiser — a camada é recalculada instantaneamente.
Toque em qualquer ponto para ver o valor exato
Toque em qualquer área colorida e o RainViewer mostra uma leitura de três linhas: o total medido, a classe de intensidade (de Vestígio a Extremo) e a janela de tempo exata coberta pelo total. No exemplo abaixo, um toque na costa leste dos EUA retorna 3.33 inch / Very heavy total / 7:00 PM yesterday - 7:00 PM today.
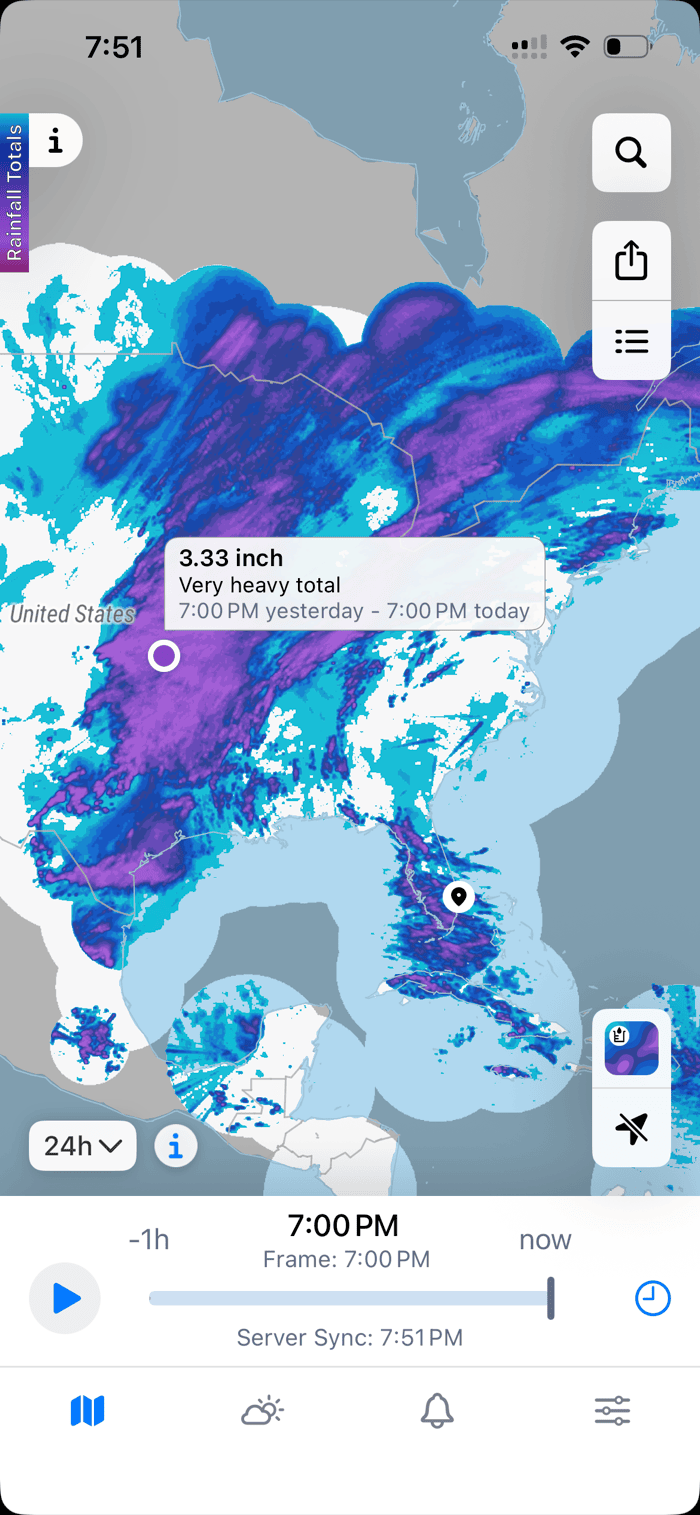
As unidades seguem o idioma e a região do seu dispositivo. Aparelhos configurados para uma região métrica mostram milímetros; aparelhos configurados para o sistema usual dos EUA ou do Reino Unido mostram polegadas. O número em si é o total real medido naquele pixel, não uma interpolação.
Lendo as cores
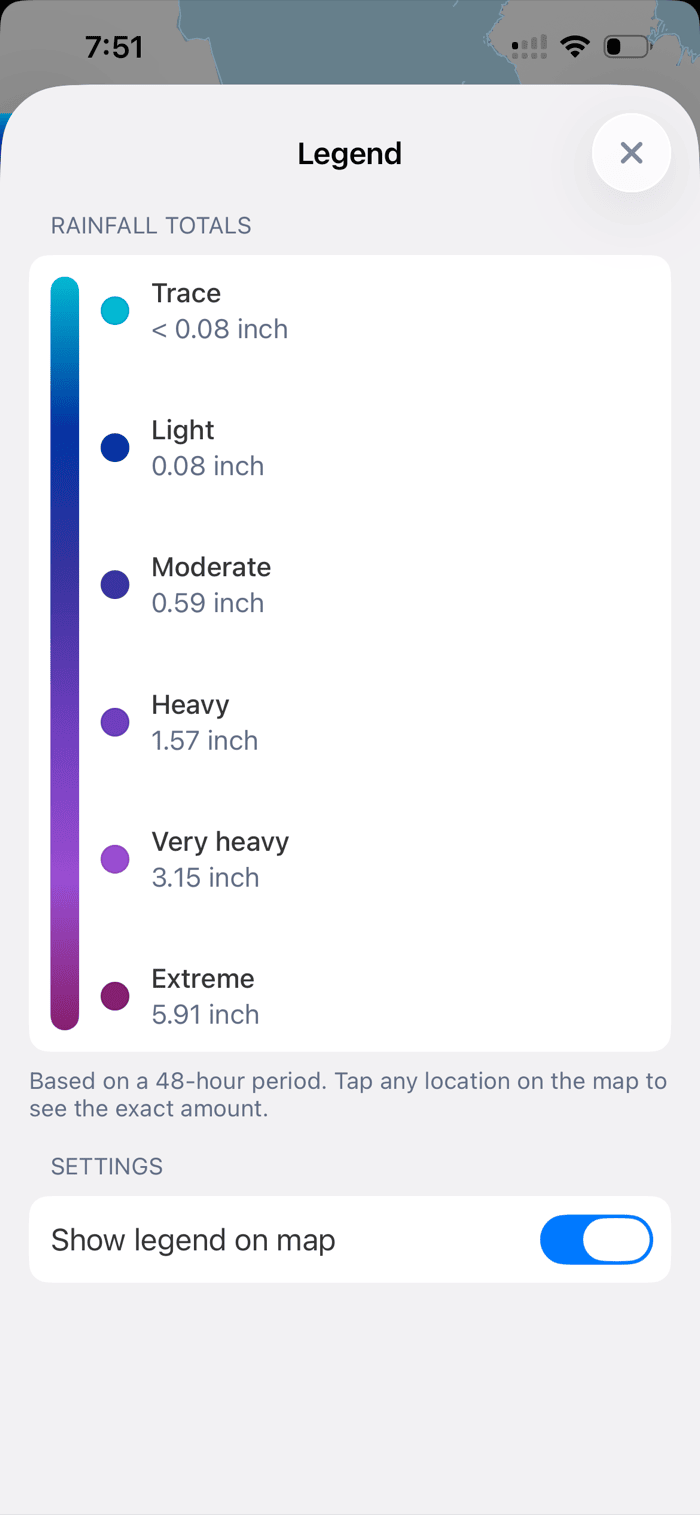
A escala de cores vai do azul-claro ao roxo intenso em seis classes — Vestígio, Leve, Moderado, Forte, Muito forte e Extremo — sobre um gradiente contínuo subjacente. As mesmas seis classes são usadas em todas as janelas, mas os limiares variam conforme a duração da janela. Os valores abaixo são os padrões para uma janela de 48 horas.
| Classe | Limiar (48h, escala padrão) |
|---|---|
| Vestígio | < 0.08 in / < 2 mm |
| Leve | 0.08 in / 2 mm |
| Moderado | 0.59 in / 15 mm |
| Forte | 1.57 in / 40 mm |
| Muito forte | 3.15 in / 80 mm |
| Extremo | 5.91 in / 150 mm |
Uma região totalmente roxa em um mapa de 48h é uma região que recebeu chuva genuinamente forte. Uma região totalmente roxa em um mapa de 1h é um lugar que acabou de levar uma chuvarada.
Para quem é
Qualquer pessoa que precise saber quanta chuva realmente caiu — não quanto foi previsto, nem o que uma única estação meteorológica conseguiu captar. Alguns casos comuns:
- Depois de uma chuvarada, voltando para casa. Aquele viaduto alagado realmente teve sete centímetros de água, ou você está lembrando maior do que era? Um toque rápido no mapa responde à pergunta. Combine com nosso guia sobre como monitorar chuvas fortes e riscos de enchente no radar se a tempestade ainda estiver ativa.
- Agricultores e produtores rurais. Dispense a irrigação quando a tempestade de ontem à noite já entregou a água do dia. Use a janela de 24h ou 48h sobre seus campos antes de ligar os pivôs.
- Trilheiros e quem planeja atividades ao ar livre. Verifique as condições de trilhas e rios após chuvas de vários dias antes de fechar uma rota. Solo encharcado, riachos cheios e trilhas destruídas acompanham os totais de chuva, não a previsão.
- Jardineiros e proprietários de imóveis. Regue o gramado com base no que caiu, não no que alguém previu na TV. O total de 24h sobre o seu endereço é a resposta mais honesta que existe.
Cobertura e disponibilidade
A cobertura corresponde à camada de radar ao vivo no RainViewer — se você consegue ver a precipitação ao vivo no mapa em um local, também pode ver os Totais de chuva ali. Isso cobre a maior parte dos Estados Unidos, Europa, Reino Unido, Austrália, Japão e uma lista crescente de outras regiões. Fora da cobertura do radar, a camada simplesmente não aparece — não há dados subjacentes para somar.
Os Totais de chuva são um recurso premium, incluído nas assinaturas Essential e PRO. Não há cobrança adicional além do seu plano atual. Você pode ver a lista completa de camadas premium na página de recursos premium , ou conferir o mapa de cobertura do radar para a sua região.
Perguntas frequentes
Os Totais de chuva são uma previsão? Não. Eles mostram apenas a chuva acumulada de varreduras de radar passadas. Para chuva prevista nas próximas horas e dias, use a camada de Previsão padrão no RainViewer.
Por que meus totais são diferentes dos de uma estação meteorológica próxima? O radar meteorológico mede a chuva na coluna de ar acima da superfície e a converte em uma estimativa por pixel. Já o pluviômetro mede exatamente um ponto no solo. Ambos estão corretos — eles respondem a perguntas ligeiramente diferentes, e pequenas diferenças entre eles são normais, especialmente em tempestades fortes ou com vento.
O que significa QPE? QPE significa Quantitative Precipitation Estimation (Estimativa Quantitativa de Precipitação) — o termo meteorológico para totais de chuva derivados de radar. É a mesma família de dados que o National Weather Service dos EUA publica como Stage IV QPE.
Funciona em todos os lugares? Apenas onde a camada de radar ao vivo tem cobertura. Verifique o mapa de cobertura antes de viajar, caso planeje contar com esse recurso.
Tem custo extra? Não. Os Totais de chuva estão incluídos nas assinaturas Essential e PRO — sem complemento ou upgrade necessário.
Abra o RainViewer e toque no ícone de camadas para experimentar os Totais de chuva (QPE) hoje.

