
Rainfall Totals (QPE)
Rainfall Totals tracks how much precipitation has accumulated in an area over time. Use it to see how much has fallen over any period, compare totals across locations, or review past precipitation up to 48 hours back.
Available in areas covered by the Radar & Pro layer.
Timeline Slider
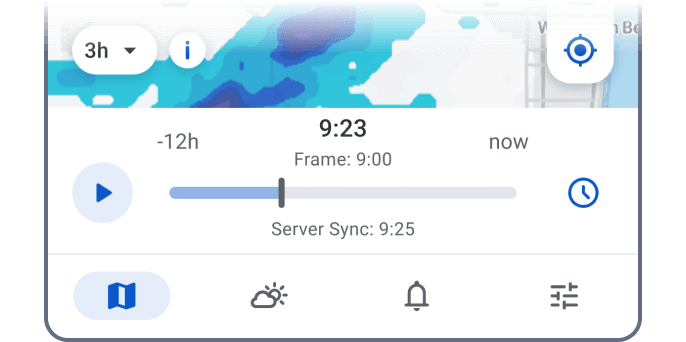
The timeline slider sets the end point of the displayed accumulation period. By default, this is the current time, so the layer shows the most recent data. Drag the slider back to shift the end point to any earlier time, up to 48 hours in the past.
This is useful when you want to check accumulation during a specific past event, such as an overnight storm or rainfall from the previous day.
Time Period Selector
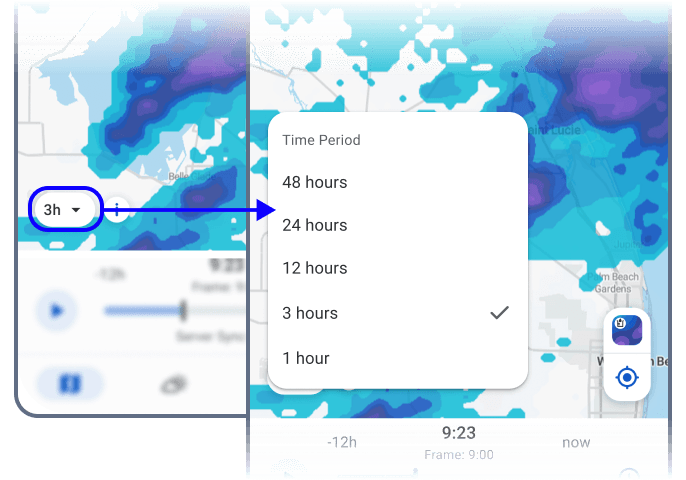
The Time Period selector sets how many hours of accumulation the animation covers. Choose from preset options between 1 and 48 hours.
Combined with the timeline slider, this lets you display any period within the last 48 hours. The slider sets the end time, and the selector sets the duration. For example, set the slider to 24 hours ago and the period to 12 hours to show accumulation from 36 to 24 hours ago.
Tap on the Map
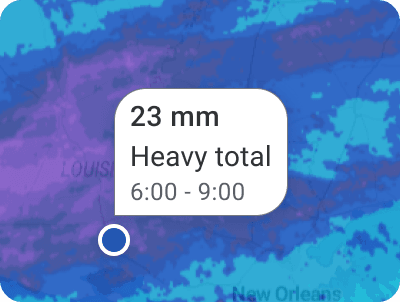
Tap anywhere on the map to see the accumulated precipitation details for that location. The panel shows:
- Amount – total precipitation that fell during the selected period
- Intensity – how heavy the accumulation was (Light, Moderate, Heavy, etc.)
- Time period – the start and end time set using the slider and Time Period selector.
 RainViewer
