Cyclone Tracker Papua New Guinea
The Storm Tracks layer shows current position, past path, forecast path, and the cone of probable tracks.


RainViewer shows storm tracks on one map for Papua New Guinea and the Coral Sea.
The Storm Tracks layer shows current position, past path, forecast path, and the cone of probable tracks.
Current cyclones near Papua New Guinea
Papua New Guinea covers the eastern half of the island of New Guinea and many islands, with the Coral Sea to the south. The Highlands run through the centre of the main island. This list names each active tropical storm or cyclone near Papua New Guinea, with its category and status, and each storm links to its own tracker page.
No active tropical storm or cyclone is listed near Papua New Guinea.
Last updated:
How RainViewer shows storms
The Australian Bureau of Meteorology publishes the official forecasts for the basin that includes Papua New Guinea. The Storm Tracks layer on the RainViewer map shows current position, past path, forecast path, and the cone of probable tracks. RainViewer does not replace official warnings.
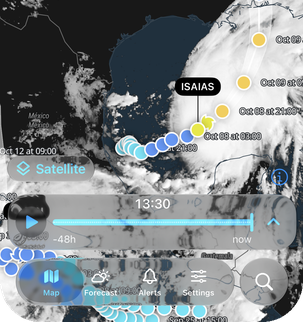
See the full storm path
Tap any point on the path to see wind speed, category and direction at that point.
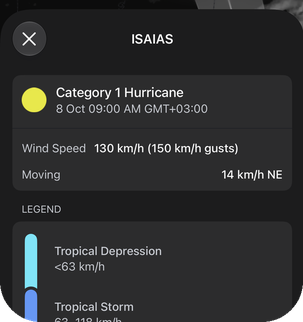
Read the category in one place
Open any storm to see its category and intensity.
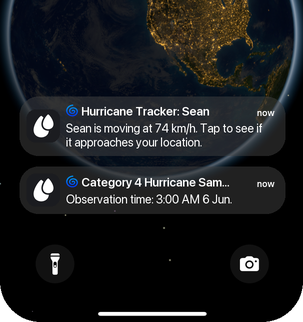
Get a notification when a storm approaches
RainViewer sends a Tropical Storm Alert when a storm approaches your area.


See Papua New Guinea storms in RainViewer
When is cyclone season in Papua New Guinea?
Cyclone season in Papua New Guinea runs from 1 November to 30 April, according to the Australian Bureau of Meteorology and the Fiji Meteorological Service.
A cyclone starts as a cluster of thunderstorms over warm ocean water. Warm, moist air rises from the sea surface. The air pressure near the surface drops, and more air flows in. The rotation of the Earth makes this air spin, clockwise in the Southern Hemisphere. Weak winds high in the atmosphere let the system organise. A system with a closed circulation is called a tropical depression. It becomes a tropical storm when its winds strengthen, and the Australian Bureau of Meteorology gives it a name. It becomes a cyclone when its winds reach cyclone strength.
Sea temperatures around Papua New Guinea are highest in the southern summer. This is the time of the most storm activity. Cyclones often form over the warm water of the Timor Sea, the Arafura Sea, and the Coral Sea. Cyclones reach Papua New Guinea mostly from the Coral Sea in the south and east.
Storms in nearby regions
Looking for storms near Papua New Guinea? See the cyclone trackers for the Solomon Islands, Australia, Indonesia, or open the tracker for all regions.
Cyclone Strength, From Depression To Super Cyclone
Depression (31–49 km/h)
A low-pressure area with organised rain. No name yet.
Deep Depression (50–61 km/h)
Heavy rain over a wide area, rough seas.
Cyclonic Storm (62–88 km/h)
The storm gets a name. Fallen branches, flooding in low-lying areas.
Severe Cyclonic Storm (89–117 km/h)
Damage to thatched roofs and power lines, coastal flooding.
Very Severe Cyclonic Storm (118–166 km/h)
Roof damage to buildings, uprooted trees, storm surge on exposed coasts.
Extremely Severe Cyclonic Storm (167–221 km/h)
Serious structural damage, communication and power lines down over a wide area.
Super Cyclonic Storm (222 km/h or higher)
Widespread destruction and major storm surge along the coast.
FAQ
Where can I see current cyclones near Papua New Guinea?
The cyclone tracker map on this RainViewer page shows current storm tracks near Papua New Guinea, and the list under the map names each active storm near Papua New Guinea. When no storm is active, the list says so and links to storms in other regions. Past storms near Papua New Guinea are listed further down the page.
When is cyclone season in Papua New Guinea, and which months are busiest?
Cyclone season in Papua New Guinea runs from 1 November to 30 April, according to the Australian Bureau of Meteorology and the Fiji Meteorological Service. The list at the top of this page shows which storms are active now. Cyclones reach Papua New Guinea mostly from the Coral Sea in the south and east.
Which official source issues cyclone warnings for Papua New Guinea?
The Australian Bureau of Meteorology (BoM) publishes the official forecasts and advisories for every active storm in the Australian and South Pacific basins, including storms near Papua New Guinea, and national weather services issue the local warnings. RainViewer shows storm tracks on a map and does not replace official warnings. Both services are sources for official basin forecasts.
What does the forecast cone show on the Papua New Guinea map?
The forecast cone on the RainViewer map shows the probable track of the centre of a storm during the forecast period. The cone does not show how far wind, rain, or storm surge reach from the centre, so areas outside the cone can still have storm effects. The cone is part of the Storm Tracks layer, together with the current position, the past path, and the forecast path.
Where can I see rain radar for Papua New Guinea?
RainViewer shows rain radar for Papua New Guinea, and the Papua New Guinea weather radar page lists radar coverage and links to city radar pages. RainViewer updates radar every 5 minutes. Radar shows rain inside a storm. The Storm Tracks layer shows where the storm is moving.
 RainViewer

