
Our Single Radar layer has become PRO Radar - a full suite of high-resolution, high-control radar products, which gives you the fastest and most accurate way to view precipitation on the map. PRO Radar is currently available in:
- Netherlands
- Finland
- Germany
- Denmark
- Sweden
- Czech Republic
- Romania
- Estonia
- Iceland
- Cyprus
What You Can Do with PRO Radar
PRO Radar turns RainViewer into a customizable radar workstation. Tap into individual radar sites and load advanced products like:
- Horizontal/Vertical Reflectivity
- Radial Velocity
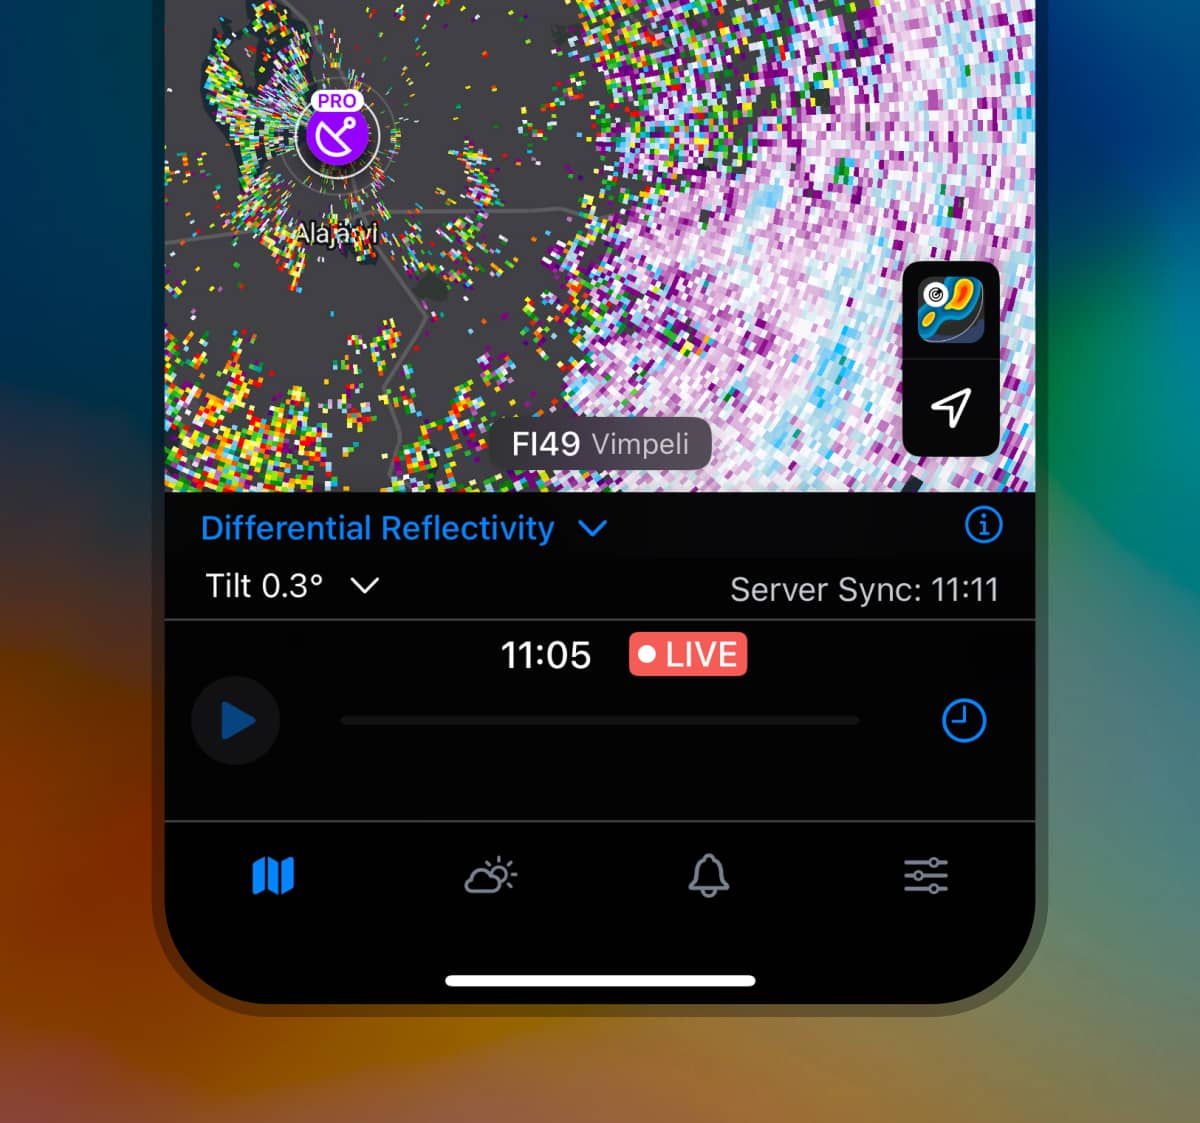
- Differential Reflectivity
- Spectrum Width
- Correlation Coefficient
- Specific Differential Phase
- and much more.
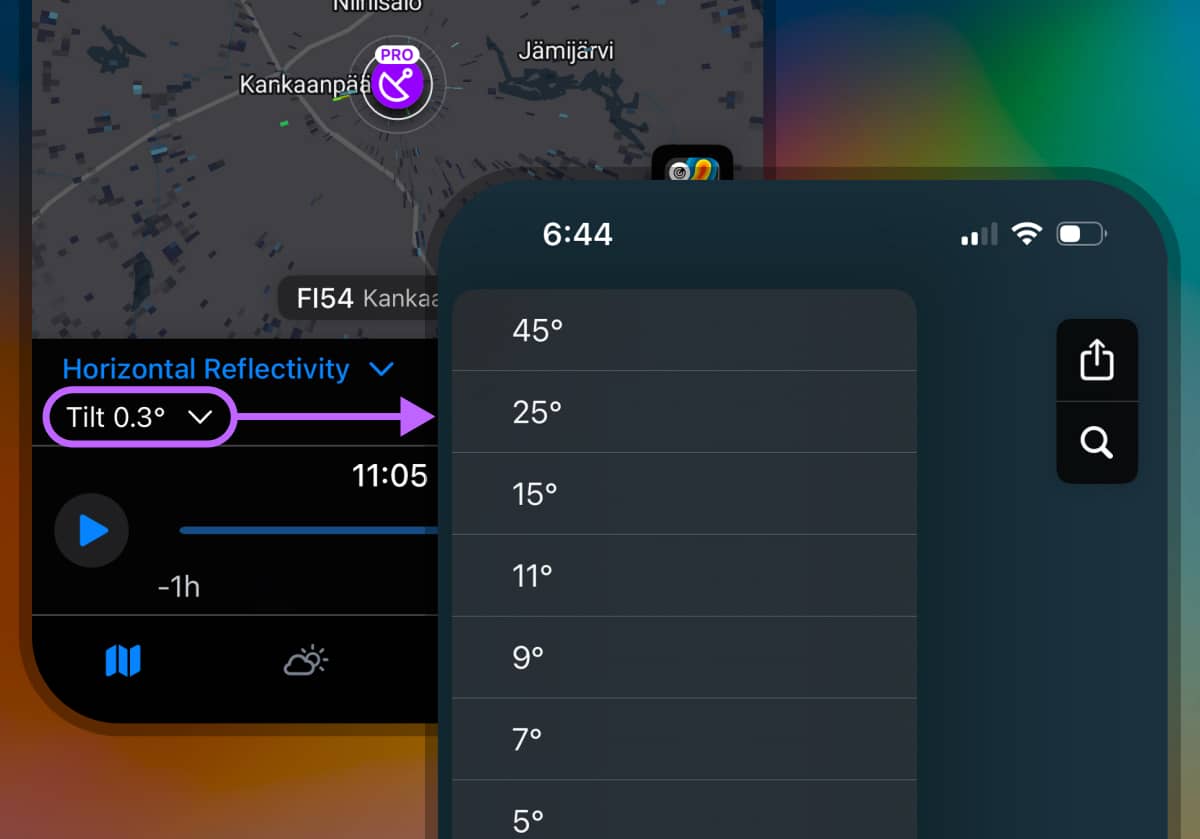
You can also adjust the radar tilt angle to view the atmosphere in vertical slices.
Why PRO Radar Matters
PRO Radar gives you raw, unfiltered radar data - delivered fast, with minimal delay. When each image updates within 3 minutes, you’re seeing storms unfold almost in real time.
There’s no smoothing, no hiding: even small clouds show up clearly. If there’s hail over your house, you’ll see it right there - no blur, no lag, just precision.
Why Tilt Control Matters
Radar tilt angle decides how high a radar beam scans the atmosphere. At the lowest settings (0.3°-0.5°), you’ll detect ground-level rain early, but also noise from buildings or trees. Storms close to the radar? They might be higher than this beam can see.
Earth’s shape means that the same 0.5° beam scanning ground-level rain nearby is looking 6-14 km up by the time it reaches 250-400 km out. So, if your radar view looks clear, rain might still be falling below the beam.
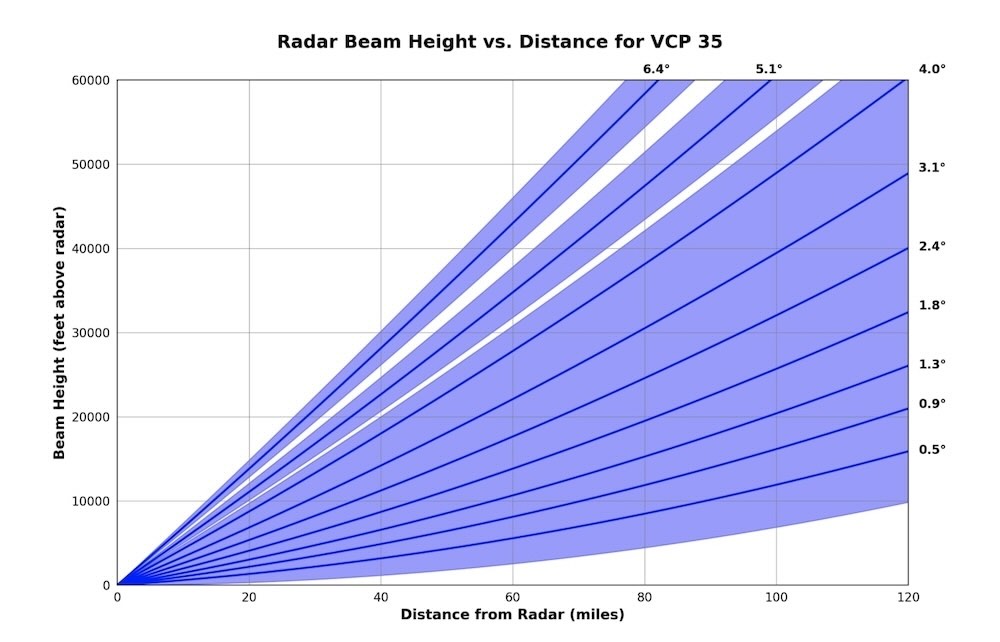
Source: NOAA
PRO Radar provides all available tilt angles, uncovering the full structure of the storm.
- -0.3° to 0.5°: Surface-level precipitation. Maximum range for scans.
- 1.5° to 3°: Mid-range precipitation + updrafts, hail cores, storm rotation.
- 4-10°: Short-range precipitation + storm tops and growth.
- 10°-90°: Near-radar precipitation + full storm height and structure.
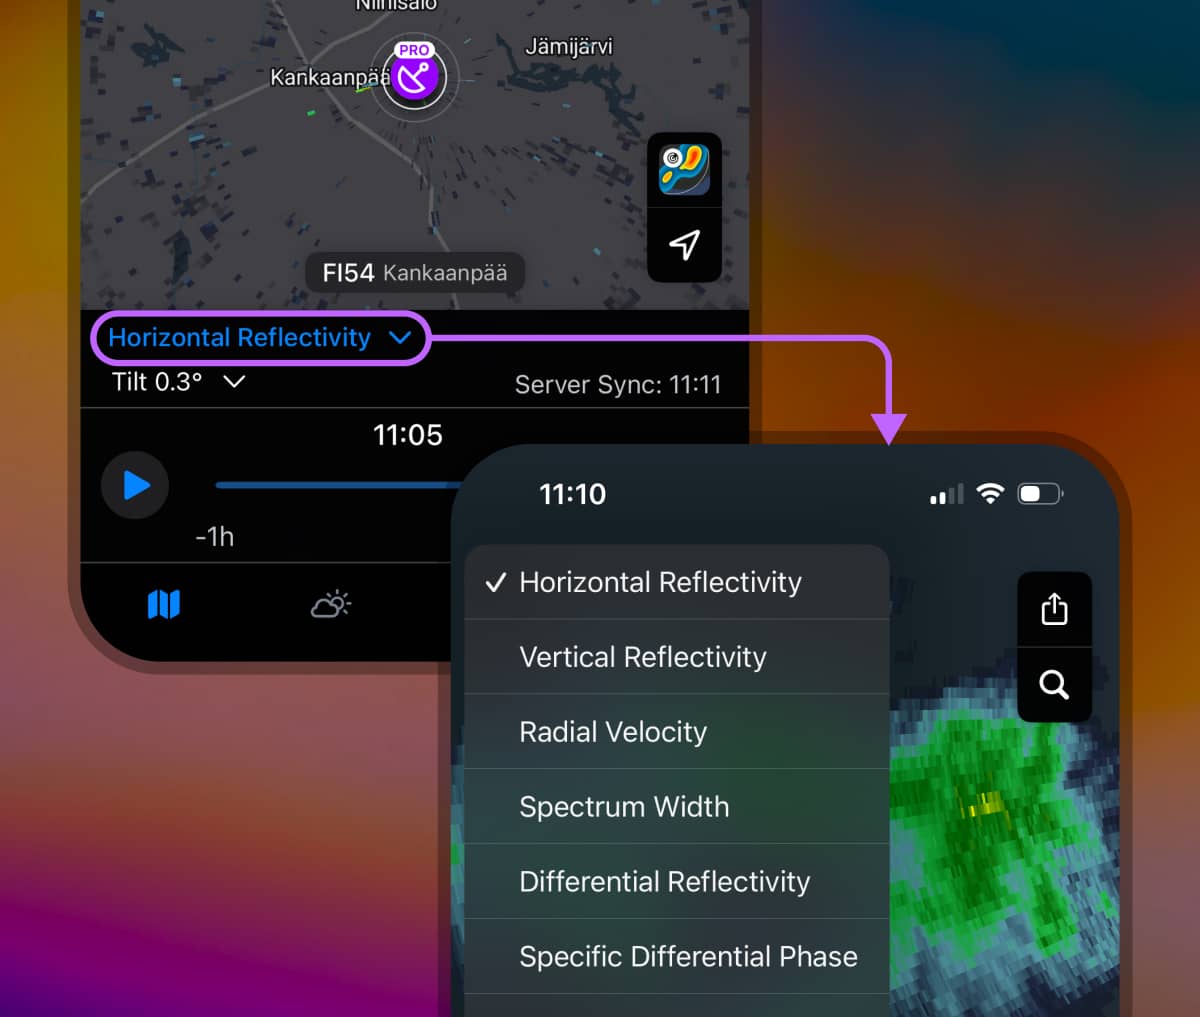
Radar Products in PRO & How to Use Them
- Open the PRO Radar map layer.
- Choose a station on the map.
- Tap the radar product label (e.g., “Differential Reflectivity”).
- Choose your radar product and tilt angle.
- Zoom, scan, and track with minimal delay of radar data.
| Radar Product | Description |
|---|---|
| Horizontal Reflectivity (DBZH) | The standard radar view that measures the power of radar signal reflected back from the particles. Higher dBZ values mean heavier rainfall - perfect for tracking showers and storms at lower altitudes. <30 dBZ = light rain 30-45 dBZ = moderate to heavy rain >50 dBZ = heavy rain, possible hail Use this to gauge intensity at a glance - helpful for planning walks, runs, or drives. |
| Vertical Reflectivity (DBZV) | Measures the same reflectivity but in vertical polarization. Want to spot a storm building strength? This view reveals the vertical structure behind the clouds. |
| Radial Velocity (VRAD) | Wondering if that line of storms is heading your way or drifting off? Radial Velocity shows how fast precipitation particles (rain, snow, or hail) are moving relative to the radar. Green means movement towards the radar, red means moving away from the radar. Forecasters across Europe use it to track Mediterranean cyclones and fast-moving fronts. |
| Correlation Coefficient (RHOHV) | RHOHV shows how uniform the radar return is - think of it as a “confidence check” on what’s in the sky. It ranges from 0 to 1, with values closer to 1 indicating uniform hydrometeors. Rain usually gives a high score (>0.97), while snow, hail, and even birds show up differently. |
| Differential Reflectivity (Zdr) | Difference between the horizontal and vertical reflectivity. Indicates the shape and orientation of particles. For example, larger Zdr suggests flatter particles like heavy rain while Zdr near zero indicates spherical particles like drizzle. |
| Specific Differential Phase (KDP) | Think of KDP as your radar’s rain intensity detector. It measures the phase shift between horizontal and vertical pulses as they pass through precipitation - basically telling you how much liquid water is out there. Expressed in °/km, KDP shines when: Identifying heavy rain (higher positive values) Detecting large, oblate raindrops associated with intense precipitation Improving rainfall rate estimates in dense precipitation Telling rain from hail or snow (low KDP means spherical stuff like snow or drizzle) Bonus: KDP doesn’t get thrown off by signal loss or calibration quirks - just clean, rain-tracking precision. |
| Differential Phase (PHIDP) | Think of PHIDP as the raw phase data your radar collects before it calculates KDP. It tracks how much the radar wave shifts as it passes through rain. You won’t use ΦDP directly but it powers the insights behind accurate rainfall mapping. |
| Signal-to-Noise Ratio (SNR) | Signal-to-Noise Ratio tells you how much real weather signal the radar is picking up vs. background junk. High SNR? You’re seeing clean, reliable data. In Europe, SNR helps: Determine data quality and reliability Filter out clutter from buildings, hills, or weak echoes Keep radar maps cleaner, especially in rough terrain |
| Hydrometeor Classification (HCLASS) | Ever wondered if radar is picking up rain, hail, or just some noisy echoes? Hydrometeor Classification sorts that out - automatically. Using dual-polarization radar data, it identifies: Rain (light, moderate, heavy) Hail (small, large) Snow (wet, dry) Graupel/soft hail Mixed precipitation Non-meteorological echoes (birds, insects, ground clutter) Forecasters use it to: Pinpoint the type of precipitation on your radar Track tricky transitions in mountainous regions Issue storm warnings faster and more accurately Keep planes safe with better airspace visibility |
| Spectrum Width (WRAD) | Turbulence on your radar? Spectrum Width tells you just how chaotic the wind is inside a storm. Measured in meters per second (m/s), it captures the range of radial wind speeds in each radar scan. Bigger values = more turbulence. Spectrum Width is used to: Spot dangerous wind shear linked to thunderstorms Help pilots navigate tricky weather conditions Map air mass boundaries and atmospheric mixing Understand flow patterns near mountains like the Alps |
More radar tools are already live. We’re keeping this list short for now. More posts on each product are coming soon! Meanwhile, download RainViewer and start exploring PRO tools.