RainViewer now includes a hurricane tracker to help you track hurricanes, typhoons, and tropical cyclones. Even better, the feature is free for everyone who uses the RainViewer app on either Android or iOS.
Tropical cyclones—commonly called hurricanes in the Atlantic Ocean, typhoons in the Western Pacific Ocean, or cyclones in the Indian Ocean—can disrupt ship and plane routes, and also can cause problems whenever they encounter human-populated places. For example, Hurricane Ida caused significant damage across several U.S. states, from Louisiana, where it made landfall, all the way to the Northeast, where it caused flooding. Some estimates have attributed more than 110 deaths linked to Hurricane Ida, along with more than $50 billion of damages. Tropical cyclones, hurricanes, and typhoons occur over warm waters as the rotation of the earth, warmth of the water and air interact. (See How tropical storms start for more details.)
The new hurricane tracking feature shows you the probable path of these potentially dangerous tropical cyclones. So now, you may use RainViewer not only to show radar-detected rain, but also as your hurricane tracker app.
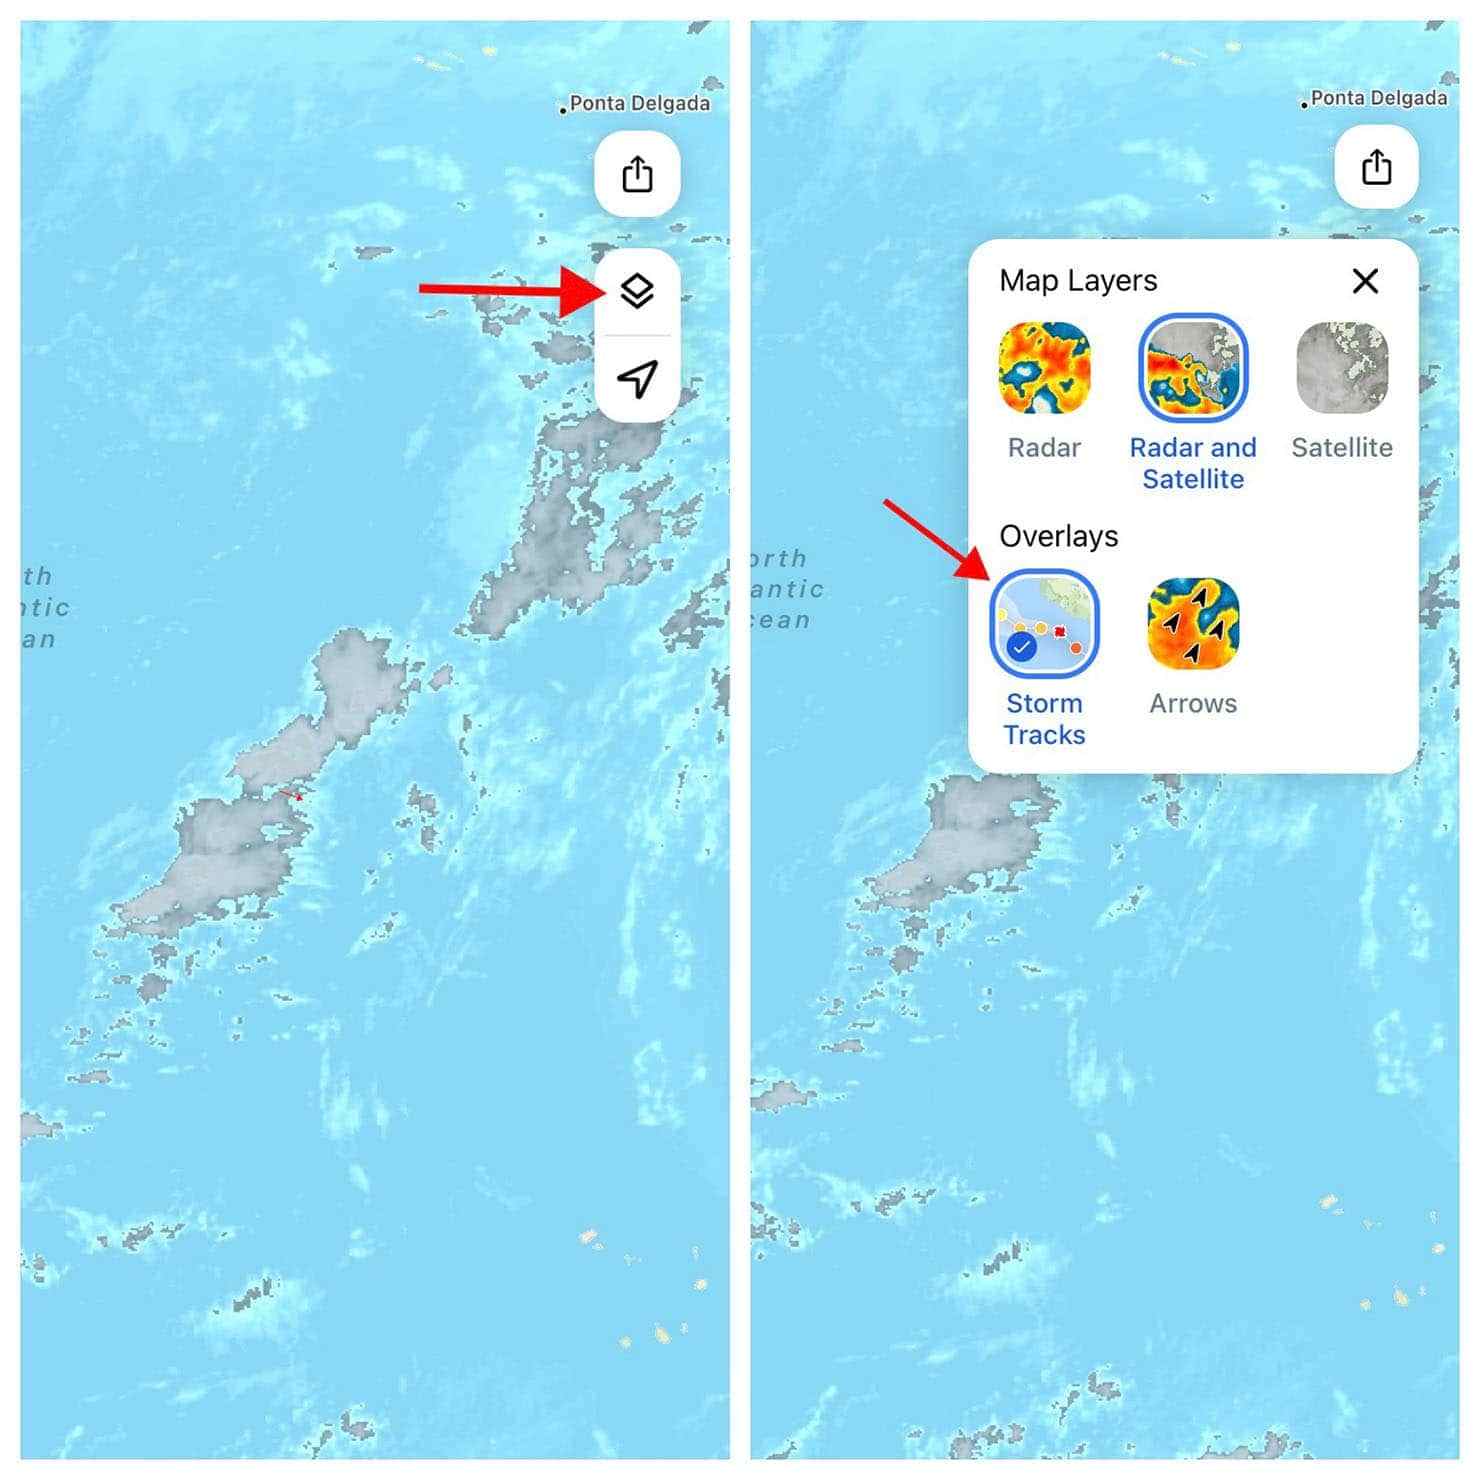
To display hurricanes, typhoons, and cyclones, tap the layer icon (upper right area), then tap Storm Tracks. Additionally, we recommend you tap Radar and Satellite view to show not only radar-detected rain near land, but also the satellite view of storms far from radar sites.
For an overview of tropical cyclones tracked in RainViewer, pinch in (with two-fingers, just as you would on Apple Maps or Google Maps) to display more of the world on the map. Each storm track shows a storm’s current location on a line that displays the storm’s past and projected path. While past and future points are circles, the current location appears as a distinctive storm icon.
The projected path of each hurricane, typhoon, or cyclone shows as both a cone and a line. The cone indicates the range of statistically probable storm routes. The line marks the middle of the projected path in the cone. Anyone around the area of a projected path of a storm should stay alert, since significant wind, rain, and flooding may occur far from the center of a storm.
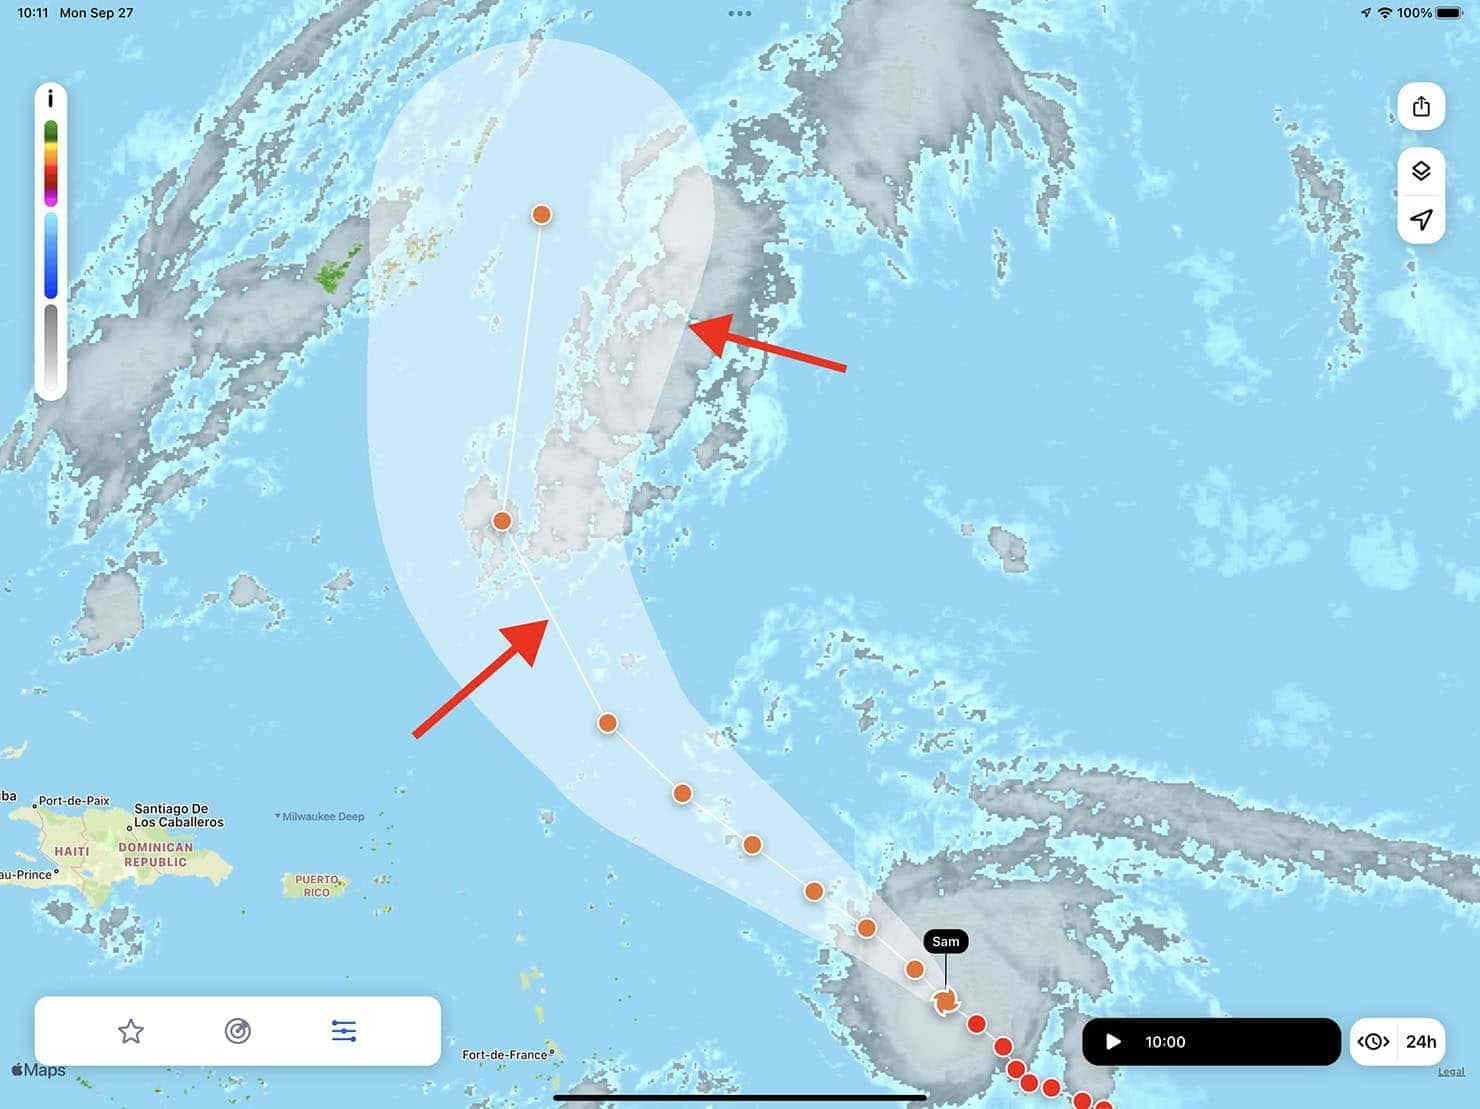
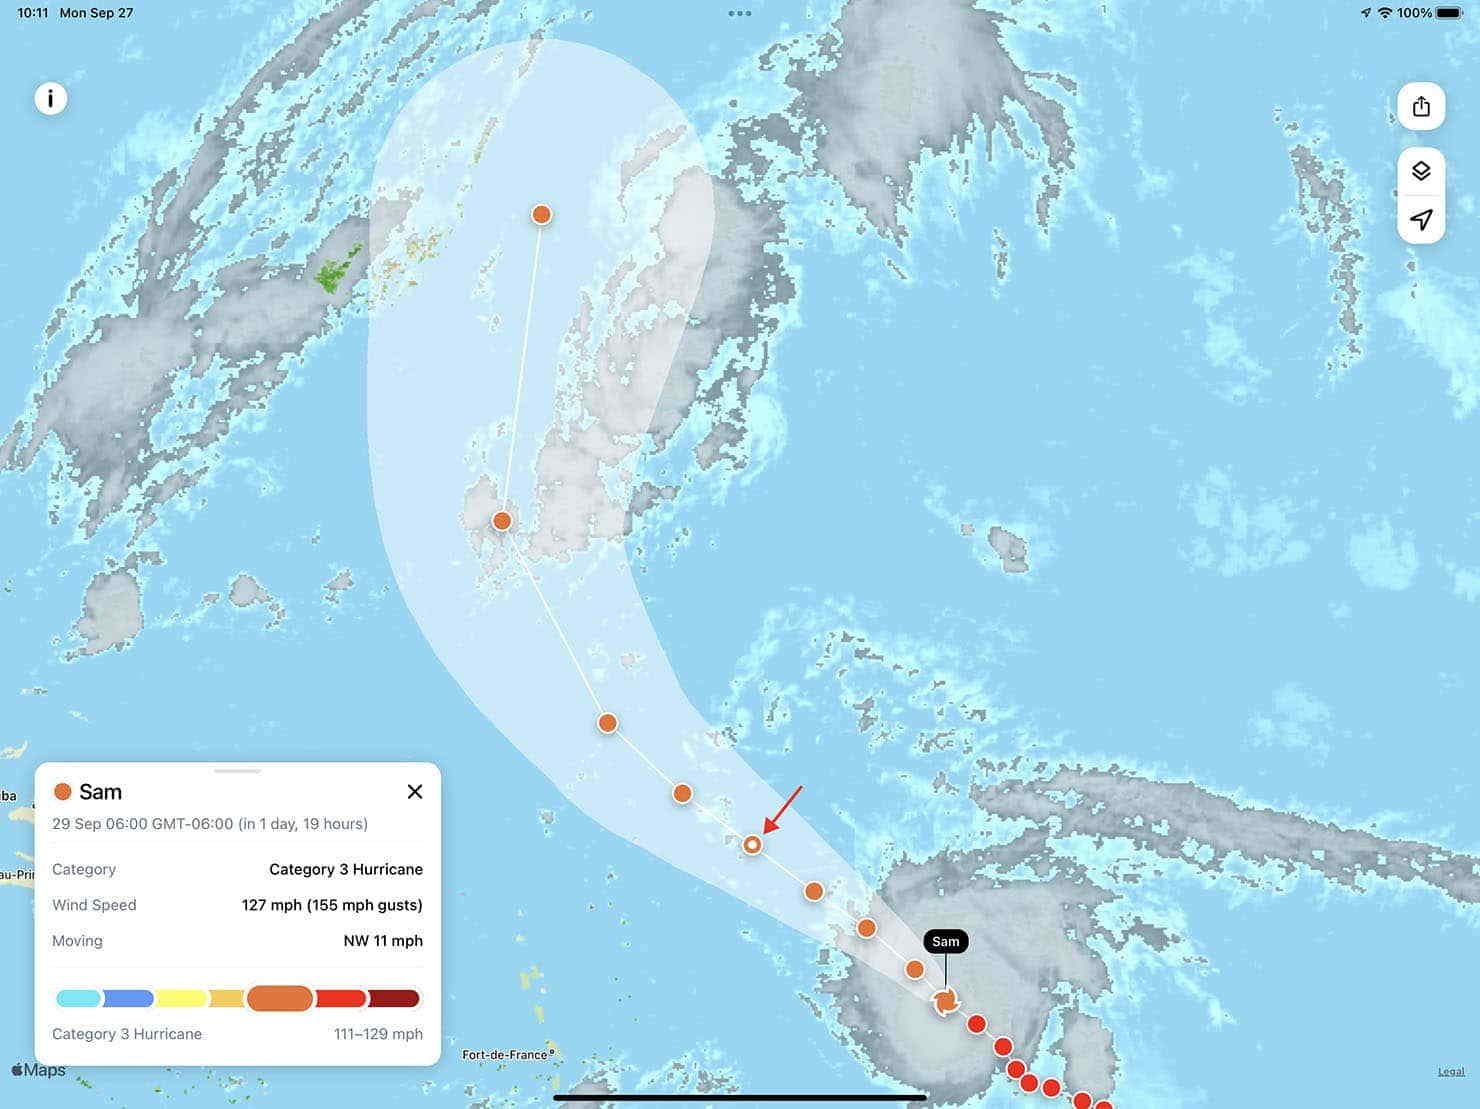
Tap any of the circles on the storm track to display more details about the storm at that particular point. With each point, the information box gives you the time (past, present, or future), along with the storm category, wind speed, and motion (shown as a general direction and speed). Note that the color of each marked point corresponds to the storm intensity level (e.g., a dark orange point denotes a Category 3 Hurricane in the Atlantic, with storm speeds between 111 and 129 mph), while the words used to categorize a storm reflect standard regional use (e.g., a storm in the Atlantic could be listed as a Category 3 hurricane, while a storm in the Western Pacific could be identified as a Typhoon).
If you share hurricane, typhoon, or cyclone information from RainViewer on social media, make sure to mention us on Facebook or Twitter. Let us know what you think of the new hurricane tracking layer in RainViewer!