
Weather radar imagery is a treasure trove of information for weather enthusiasts. Knowing how to interpret these images can be incredibly rewarding. This guide will walk you through the basics of radar imagery, covering key concepts like reflectivity, velocity, and precipitation intensity.
How Weather Radar Works
Weather radar , short for Radio Detection and Ranging, is a system that uses radio waves to detect and map precipitation. When a radar sends out radio waves, they bounce off objects like raindrops, snowflakes, or hail. The radar then captures these returned signals to determine the location, intensity, and movement of precipitation.
Radars are essential tools for meteorologists, helping them monitor storms, predict rainfall, and issue severe weather alerts .
Weather Radar Types: Exploring the Variations
Weather radar comes in different types, each serving specific purposes in weather monitoring and prediction. Here’s a breakdown of the most common radar systems:
Doppler Radar
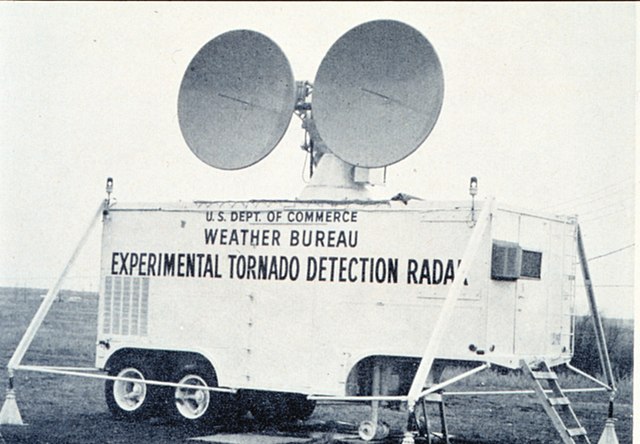 Source: NOAA Photo Library on Flickr, Public domain, via Wikimedia Commons
This is the most widely used radar system in weather forecasting. Its work is based on the Doppler effect - change of wavelength and frequency caused by motion of the source. By measuring the velocity of precipitation particles, it provides valuable data about wind patterns and storm rotation. Doppler weather radars are essential for detecting severe weather, such as tornadoes, hurricanes, and thunderstorms, by analyzing the motion of precipitation.
Dual-Polarization Radar
Dual-polarization radar represents a significant advancement in radar technology. Unlike traditional radar that sends out a single energy pulse, dual-polarization radar transmits both horizontal and vertical pulses. This allows it to distinguish between different types of precipitation, such as rain, snow, hail, and sleet. It improves the accuracy of storm tracking and enhances the identification of precipitation types, which is especially useful in winter weather forecasting.
Weather Surveillance Radar (WSR-88D)
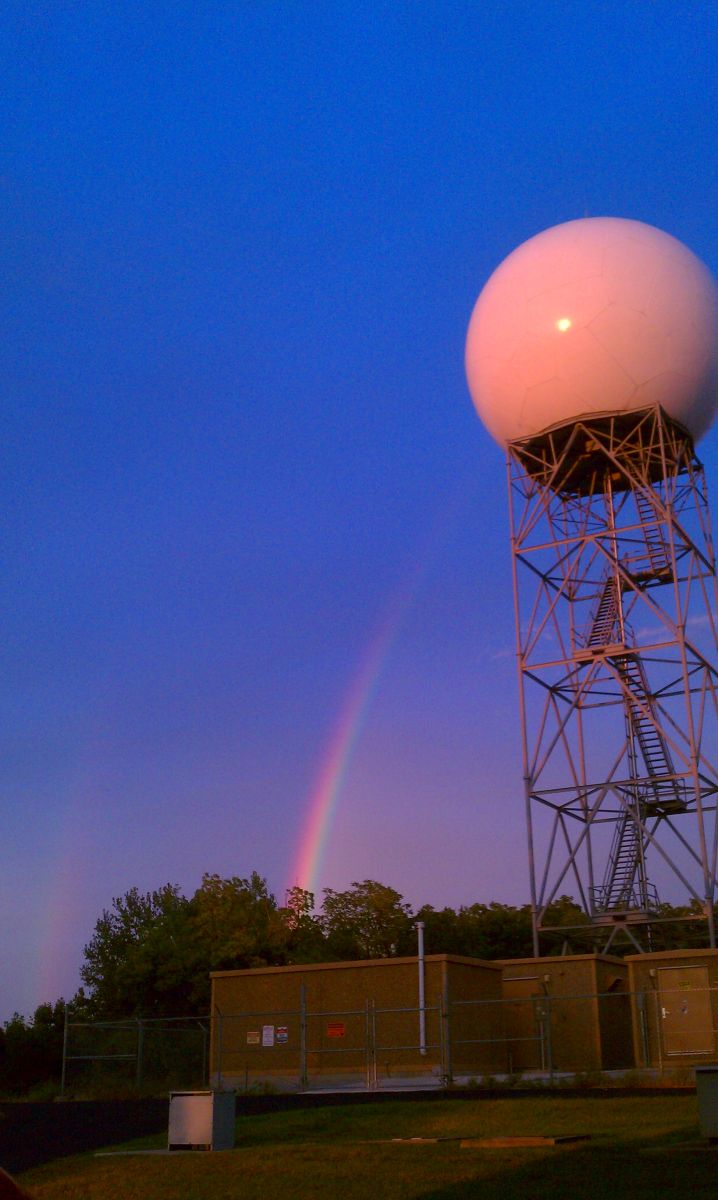 Source: National Weather Service
The WSR-88D is a specific type of Doppler radar used by the National Weather Service in the U.S. Designed for comprehensive weather surveillance, it can track precipitation, wind, and storm structures in real time. It operates at 2.7 GHz and is equipped with both Doppler and reflectivity capabilities, providing a detailed picture of the weather.
Phased-Array Radar
Phased-array radar uses electronically controlled antennas that can rapidly change direction without physically moving the radar dish. This allows for continuous scanning of large areas and quick adjustment of the radar focus to specific regions of interest. It’s particularly valuable for monitoring fast-moving weather events like tornadoes or severe thunderstorms .
The Anatomy of a Radar Image
Radar display images may seem complex at first glance, but they can be broken down into simpler components:
Radar Reflectivity
Reflectivity is one of the most common types of radar data. It measures the amount of energy reflected back to the radar by precipitation particles. The highest reflectivity values generally indicate the heaviest precipitation.
- Low: Indicates light precipitation, such as drizzle or light rain.
- Moderate: Signifies moderate rain or mixed precipitation.
- High: Represents heavy rainfall, hail , or intense storms.
Reflectivity is typically displayed in decibels related to Z (dBZ). Z is the reflectivity factor of a remote object to the return of a droplet of rain with a diameter of 0.03 inches (1 mm). dBZ values above 60 often signal severe weather conditions, like hail-producing thunderstorms.
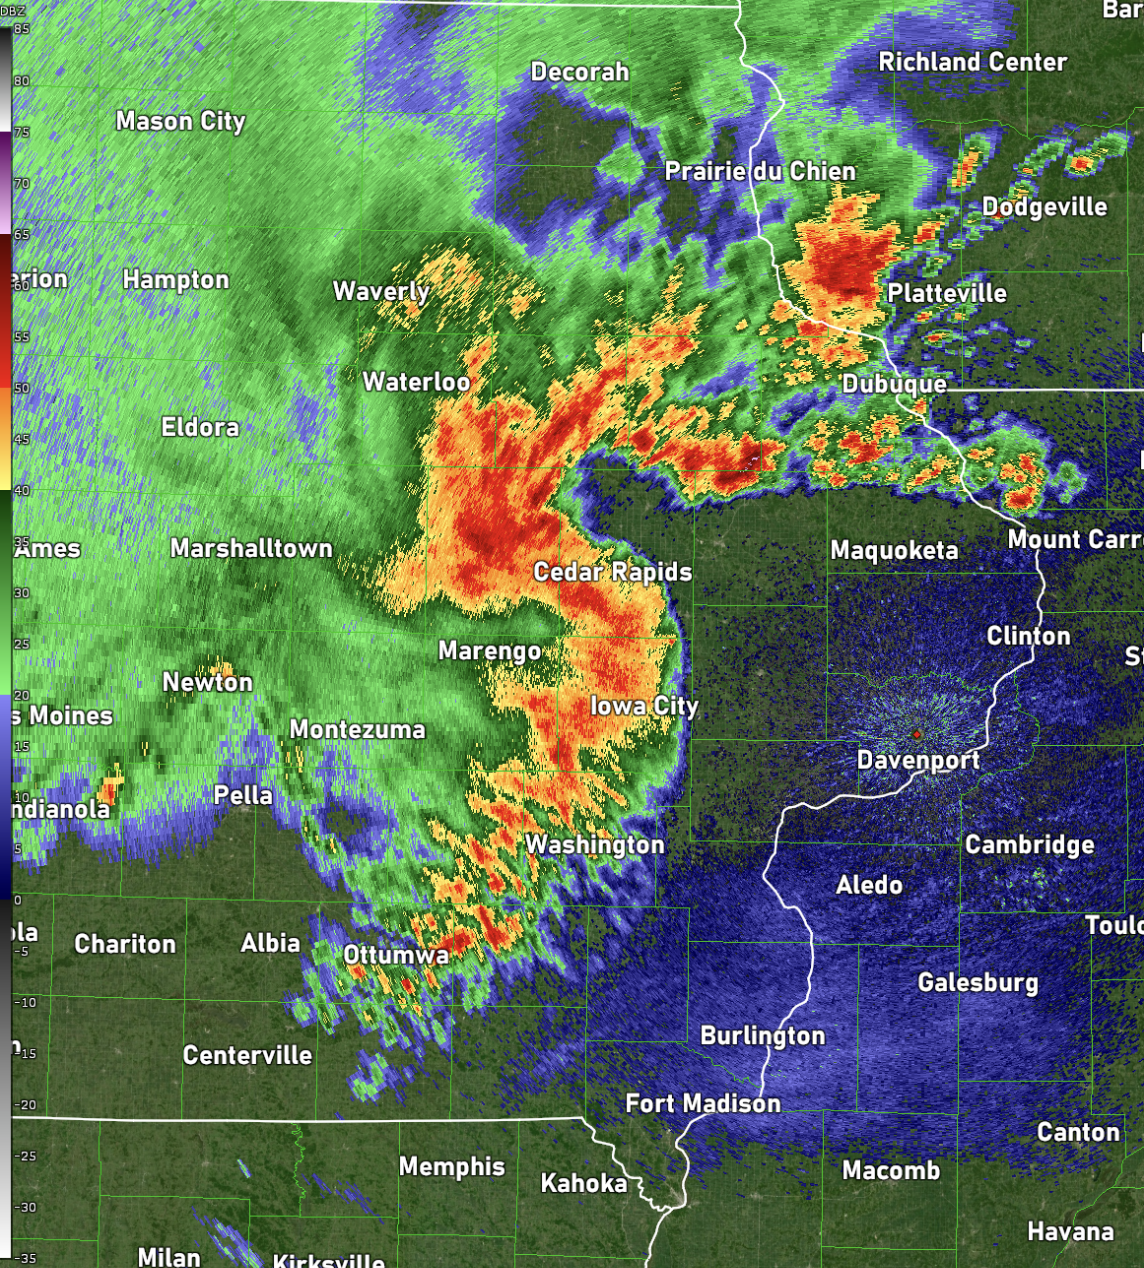 Source: NOAA
Velocity
Velocity data, made possible by Doppler radar, shows the movement of precipitation particles relative to the radar. This helps meteorologists detect wind patterns within storms.
- Inbound: Indicates precipitation moving toward the radar.
- Outbound: Shows precipitation moving away from the radar.
By analyzing velocity data, meteorologists can identify rotation within storms, which may indicate the development of tornadoes.
Precipitation Intensity
Precipitation intensity refers to how much rain or snow falls in a given area. Intensity is directly related to reflectivity but focuses more on the impact on the ground.
- Light: Drizzle or light snow, often producing less than 0.09 inches (2.5 mm) per hour.
- Moderate: Steady rain or snow, producing 0.09 to 0.2 inches (2.5 to 7.6 mm) per hour.
- Heavy: Downpours or heavy snow, exceeding 0.2 inches (7.6 mm) per hour.
How to Read Weather Radar Images
Now let’s find out how to interpret weather radar images.
Step 1: Understand the Radar Legend
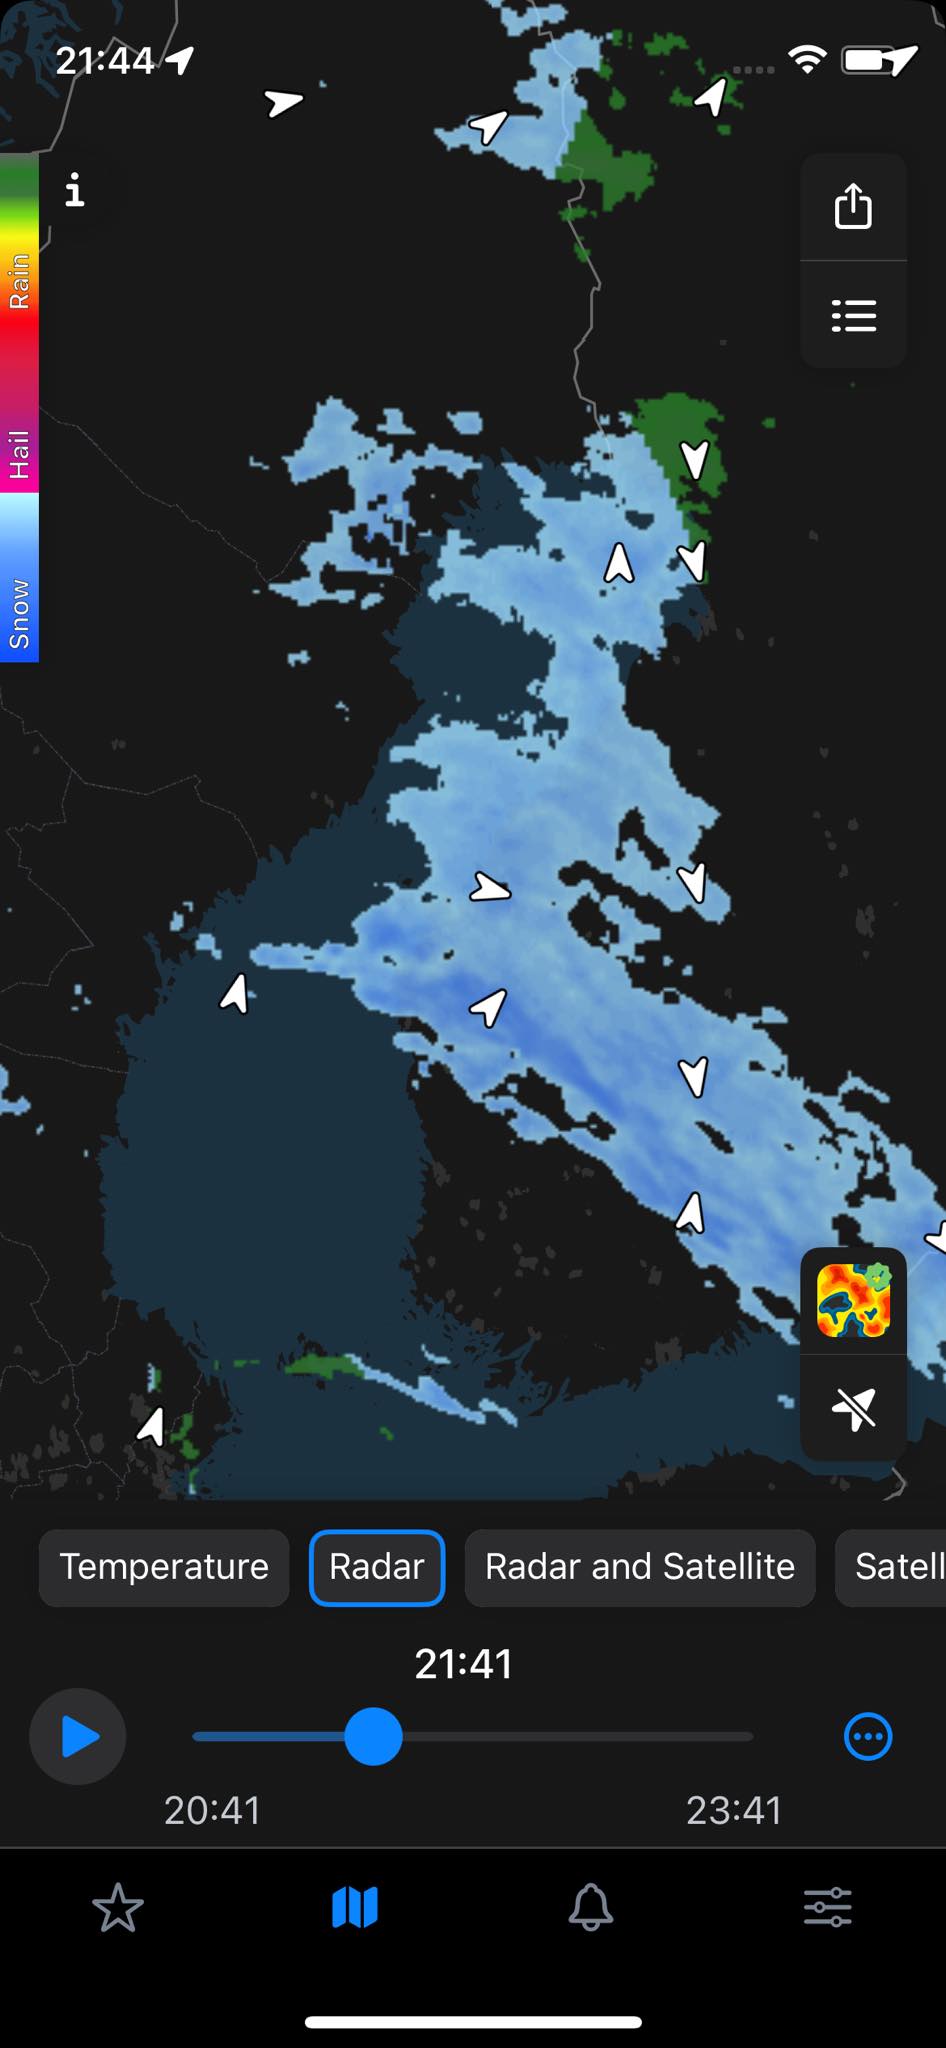
Each image includes a legend that explains the colors used to represent different levels of reflectivity, velocity, or intensity. Familiarize yourself with this legend before analyzing the image. For example, here’s how the weather radar map legend looks in the RainViewer weather app (the NOAA color scheme was selected here):
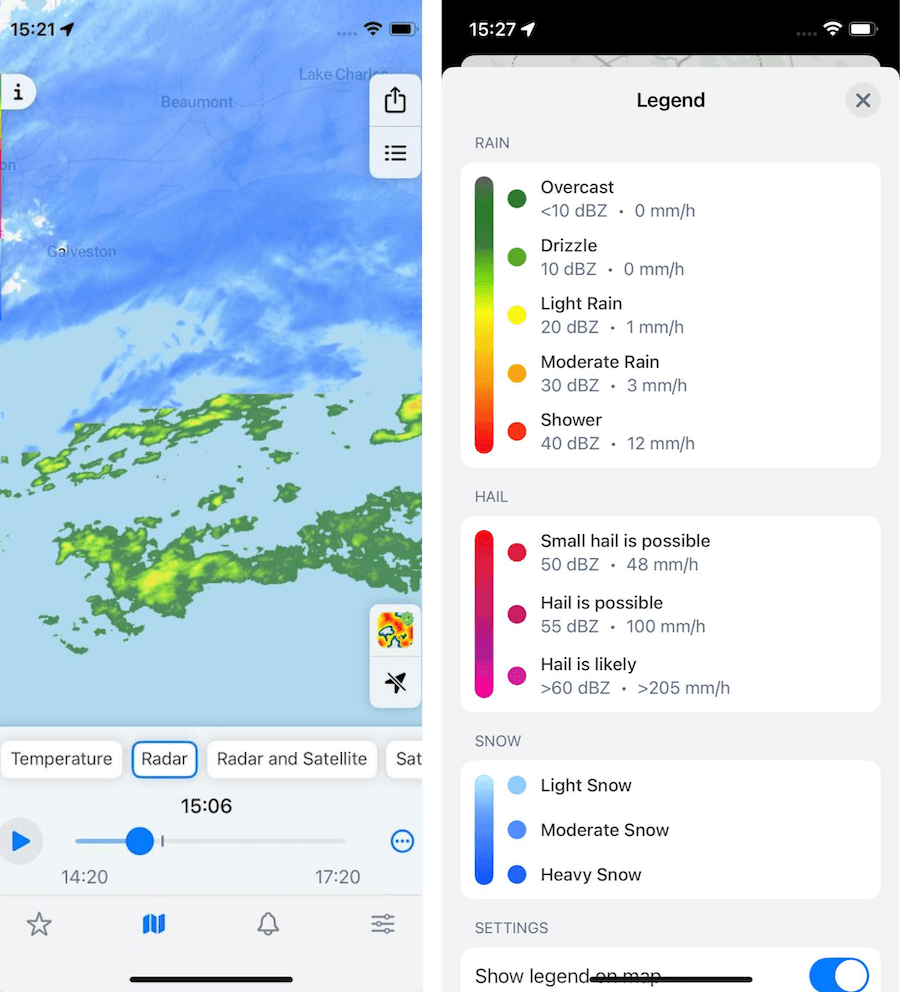 Source: RainViewer
Step 2: Identify Precipitation Patterns
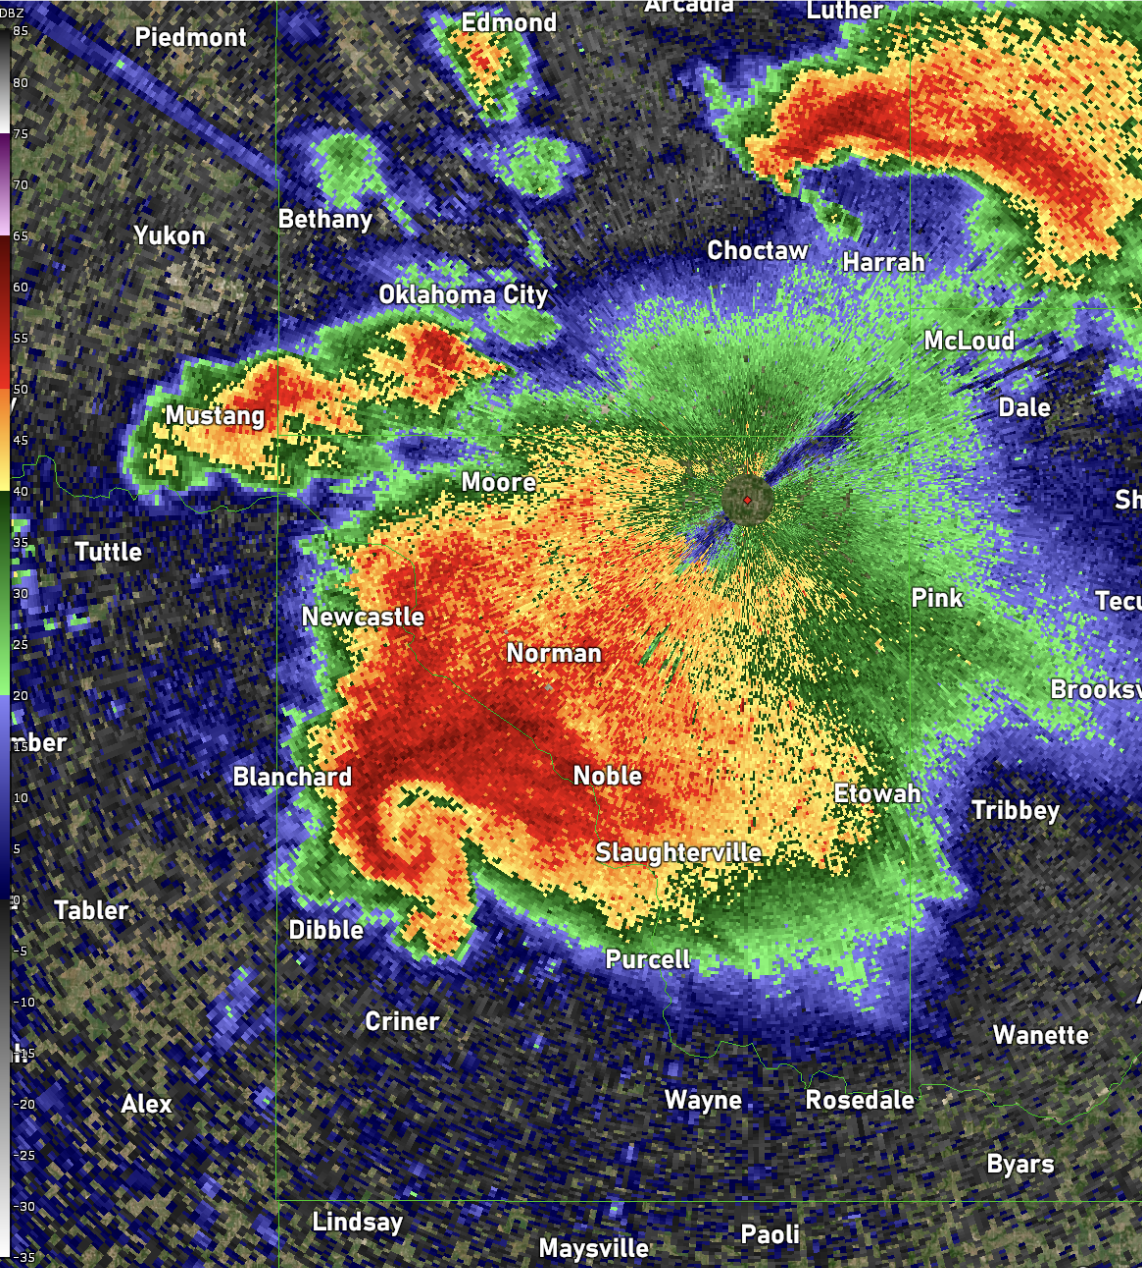
Look at the spatial distribution of colors on the radar map. Broad, uniform areas of green or yellow suggest steady rain, while clusters of red or purple may indicate thunderstorms or hail.
Step 3: Observe Movement
Images are often presented as animations. Watching these animations can help you understand how weather systems are moving and evolving. Pay attention to the speed and direction of movement.
 Source: RainViewer
Step 4: Look for Warning Signs
Velocity data can help you spot potential severe weather. If you notice areas of tightly packed red and green colors, this could indicate strong rotation within a storm, signaling a tornado risk.
Common Radar Data Terms
- Beam height. The altitude at which the radar beam is scanning. Higher beams capture precipitation in the upper atmosphere.
- Ground clutter. Non-weather objects, like buildings or mountains, that reflect radar signals.
- Echo top. The highest point of precipitation detected by the radar, which is often used to estimate storm strength.
- Hook echo. A radar signature, which is often associated with tornado-producing supercell storms .
Conclusion
Weather radar imagery is a fascinating and invaluable tool for understanding the complexities of our atmosphere. By learning to interpret reflectivity, velocity, and precipitation intensity, you can unlock the secrets of weather patterns and stay ahead of changing conditions.