
In our continuing series on PRO Radar products in RainViewer , we’re exploring the tools that elevate storm tracking from basic observation to advanced weather analysis. Today’s spotlight is on two dual-polarization radar products: Differential Reflectivity (ZDR) and Correlation Coefficient (RHOHV). These tools reveal the internal structure of storms, offering insights into what’s falling from the sky, how it’s forming, and what might come next.
For weather enthusiasts looking to sharpen their radar-reading skills, ZDR and RHOHV are powerful pieces of the puzzle. Together, they help distinguish raindrops from hailstones, snow from sleet, and even meteorological echoes from biological clutter like birds or insects. Let’s dive in.
What Is Differential Reflectivity (ZDR)?
Differential Reflectivity is a dual-polarization radar product. Unlike conventional radar, which sends out horizontally polarized pulses, dual-pol radar emits both horizontal and vertical pulses. This allows the system to compare how targets reflect each pulse orientation.
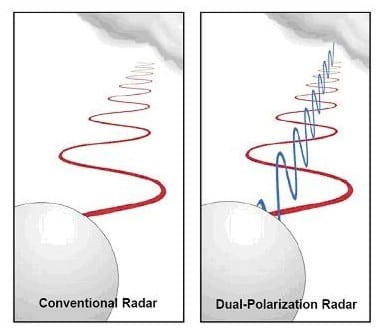
Source: Georgia Tech
Radar reflectivity gives us information about the strength of the returned signal, which helps estimate precipitation intensity. But reflectivity alone doesn’t distinguish between a torrential downpour and a hailstorm, since both can produce high values. That’s where ZDR comes in.
ZDR measures the difference in reflectivity between horizontal and vertical radar returns. In simple terms, it tells us how flat or round the targets are.
ZDR values are measured in decibels (dB) and typically range from -1 to +5 dB, though most operational use falls between 0 and 4 dB.
- High ZDR values (e.g. 2-4 dB): Indicate horizontally elongated targets like large raindrops falling with their flat sides parallel to the ground.
- Low or near-zero ZDR values (~0 dB): Suggest spherical or irregular shapes, such as small hailstones, graupel, or dense ice pellets.
- Negative ZDR values (rare): May appear in cases where particles are vertically aligned or tilted due to strong wind shear or unusual ice crystal orientation.
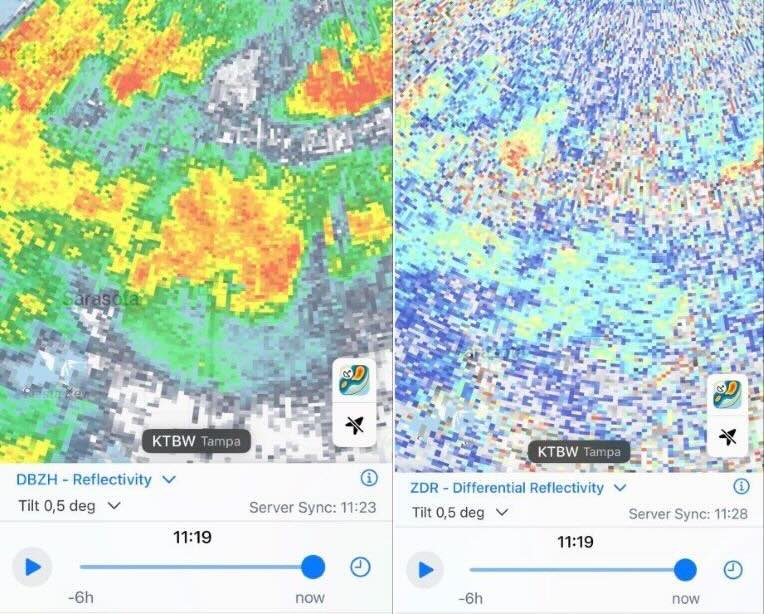
In the side-by-side scan above, some of the heaviest DBZH zones align with low ZDR spots, which may mean hail contamination. Meanwhile, the broader storm areas show moderate ZDR = flattened rain drops, typical of tropical convection.
What Is Correlation Coefficient (RHOHV)?
RHOHV is another dual-pol radar product that compares the similarity of horizontal and vertical radar return signals. Unlike ZDR, which focuses on shape, RHOHV tells us how consistent the shapes, sizes, and orientations of particles are within a radar sample volume.
RHOHV is unitless and ranges from 0.0 to 1.0. In practice:
- >0.97 = Pure precipitation, typically rain or snow.
- 0.90-0.97 = Mixed-phase precipitation (e.g. melting snow, sleet).
- <0.90 = Hail cores, debris, or biological/non-meteorological clutter.
This product is especially valuable when trying to determine how clean or messy the radar sample is.
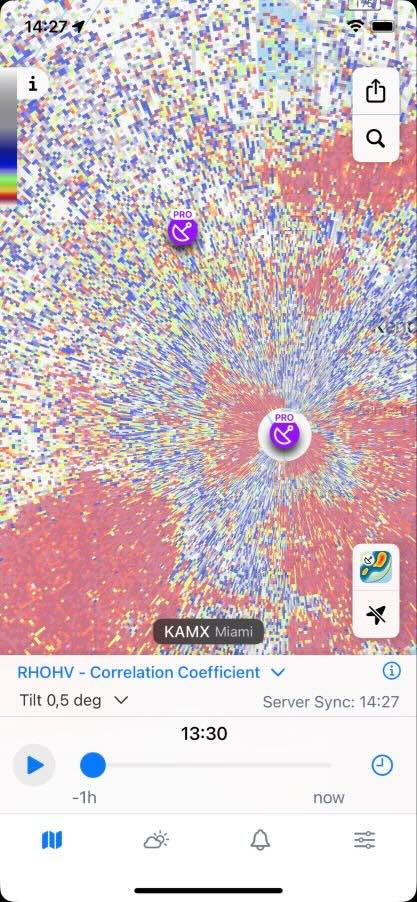
In the scan above, the red-to-purple background means widespread high RHOHV (~0.98+), consistent with clean rain or stratiform precipitation. But if we look closer, we’ll see pockets of blue, white, and purple, especially near the radar and west of it. This noisy zone suggests:
- Low correlation (likely <0.90)
- Possibly hail, debris, or biological targets like birds or insects
Why ZDR and RHOHV Work Better Together
While ZDR shows particle shape, RHOHV shows consistency. Alone, each tells a part of the story. Together, they offer a much more complete interpretation of what’s occurring inside a storm.
For example:
- Low ZDR + Low RHOHV: Strong indicator of hail - irregular shapes, inconsistent sizes.
- High ZDR + High RHOHV: Classic rain signature - flattened drops with uniformity.
- Spiking ZDR + Dropping RHOHV in a horizontal band: Likely the melting layer, where snowflakes are transitioning into rain.
How to Read ZDR and RHOHV in RainViewer’s PRO Radar
In RainViewer’s PRO Radar mode, you can select ZDR and RHOHV from the radar product menu when viewing individual radar stations marked with PRO. Here’s how to interpret them:
ZDR (Differential Reflectivity)
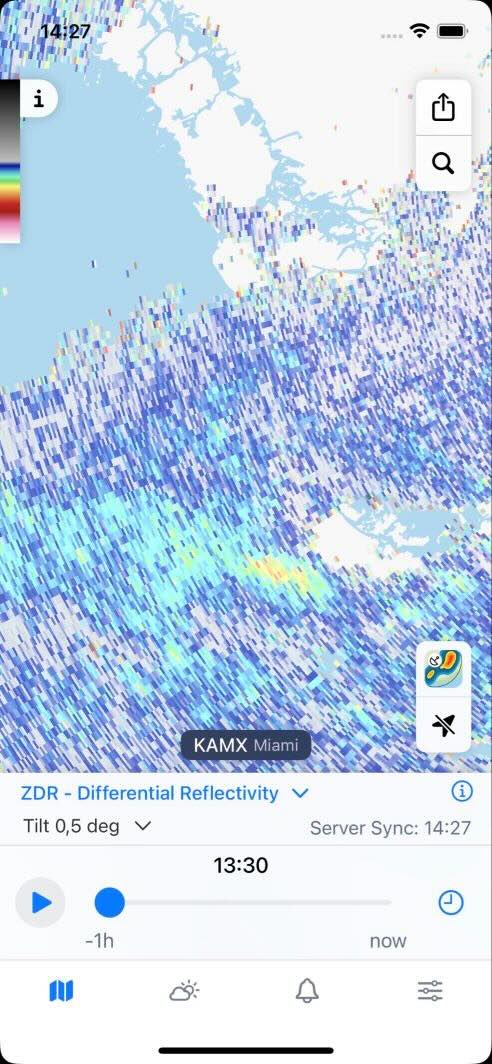
- Warm colors (red, orange): High values = large, flat raindrops. In the scan above, you can see a few yellow patches confirming this.
- Cool colors (blue, green): Low or near-zero values = hail, graupel, or small snow.
- Transitions: Look for bands or gradients in ZDR to detect melting layers.
RHOHV (Correlation Coefficient)
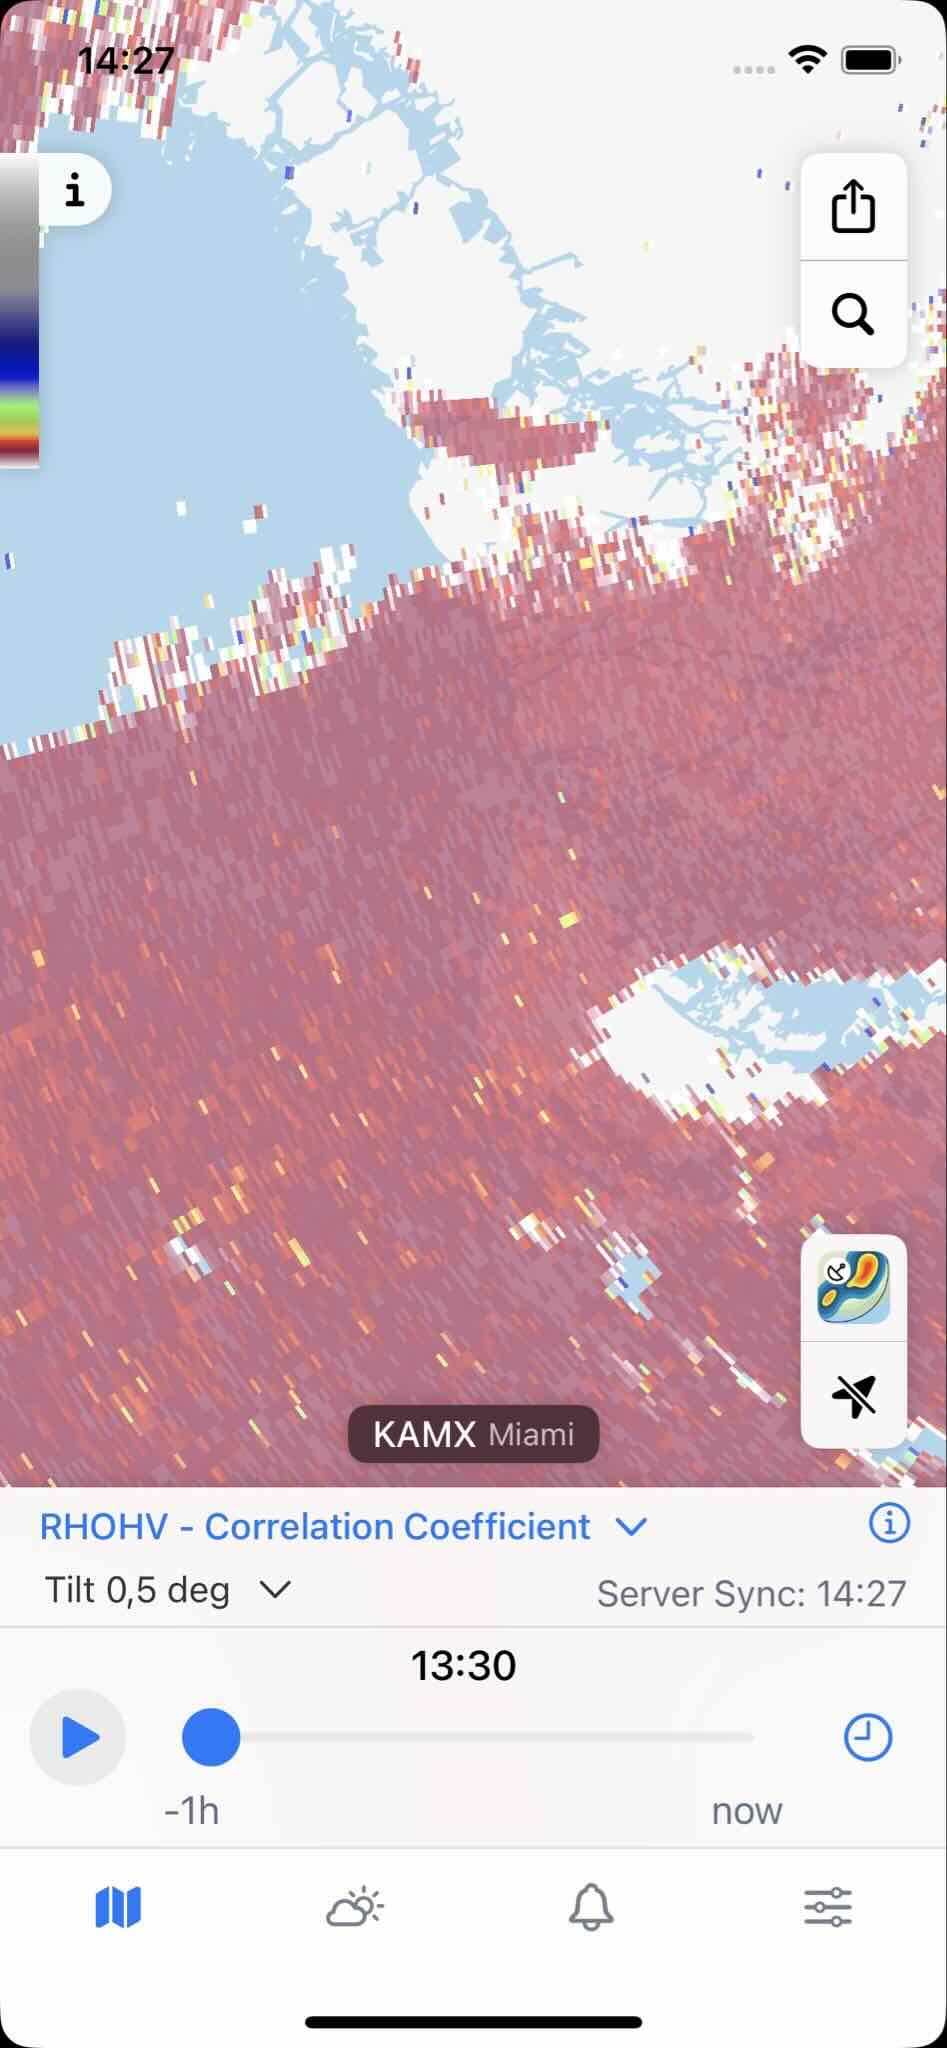
- Warm colors (yellow to red): High uniformity, typical of rain or snow.
- Cool colors (green to blue): Irregular or mixed targets - hail, sleet, or non-weather echoes.
- Sharp drops in RHOHV: May indicate hail cores or biological clutter. Values below 0.85 are often red flags.
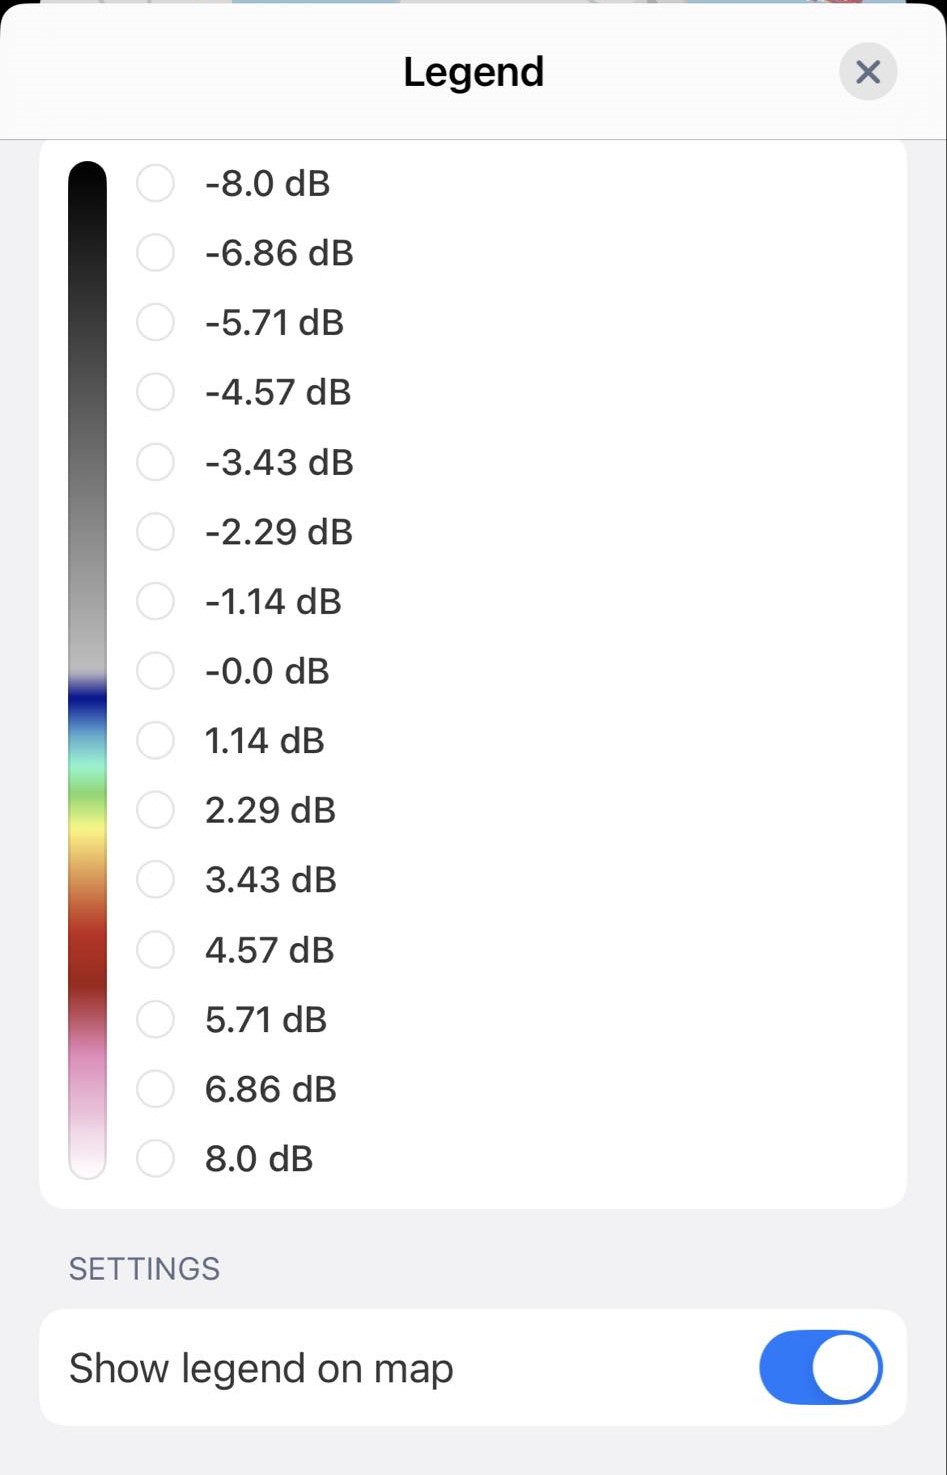
Tip: You can interpret the color meanings by opening the legend on the map.
Forecasting Applications: When ZDR and RHOHV Become Clues
These dual-pol products are used together in a wide range of forecasting scenarios:
Hail Detection
High reflectivity alone can’t confirm hail, but combining radar products can. A core with:
- High Reflectivity (Z)
- Low ZDR (~0 dB)
- Low RHOHV (<0.90)
is almost certainly hail.
Melting Layer Identification
The radar “bright band” forms when snowflakes begin to melt, increasing their reflectivity and flattening their shape.
- ZDR increases sharply.
- RHOHV dips slightly (~0.90-0.95) due to mixed-phase particles.
This combo marks the snow-to-rain transition zone - a key feature for winter storm analysis.
Non-Meteorological Echo Detection
Birds, insects, and airborne debris (like from tornadoes) tend to have low RHOHV and often erratic or low ZDR. If reflectivity is low but RHOHV is suspiciously low too, it’s likely not precipitation.
Real-World Radar Puzzle: Using ZDR + RHOHV
Picture this: A spring thunderstorm builds rapidly over your location. Radar reflectivity spikes to 60+ dBZ - intense, but is it rain or hail?
You check the ZDR and the storm core reads 0.3 dB - that’s too low for big raindrops. In the same core, the RHOHV values drop to 0.87 - far from the 0.98+ you’d expect for uniform rain.
Conclusion? You’re looking at a hail-producing cell. With high reflectivity, low ZDR, and low RHOHV, the radar tells a consistent hail story.
Final Thoughts
ZDR and RHOHV may sound like technical jargon, but together they unlock radar’s full storytelling power. These products transform reflectivity from a 2D snapshot into a multi-dimensional precipitation analysis:
- Is it hail or rain?
- Where is snow turning to sleet?
- Are we seeing birds, debris, or real weather?
By learning to interpret ZDR and RHOHV side by side, you sharpen your storm-tracking intuition. It’s not just about what’s on the radar - it’s about what the radar means. So next time a storm rolls in, head to RainViewer’s PRO Radar, pick a radar station, and explore these dual-pol tools. Every scan is a chance to decode the atmosphere.