
Welcome to our deep dive into RainViewer PRO Radar tools . Today, we’re spotlighting one of the lesser-known, but highly insightful radar layers: Spectrum Width (WRAD).
If you’ve already explored Reflectivity, Velocity, and Correlation Coefficient in the app, you know each radar product offers a unique perspective on storm structure. WRAD adds another layer by helping identify storm turbulence, wind shear, and radar uncertainty. Let’s break it down and see how this advanced radar layer can enhance your forecasting toolkit.
What Is Spectrum Width (WRAD)?
Spectrum Width measures how much the speeds of raindrops, snowflakes , or debris vary within a single radar beam. While Velocity tells you how fast targets are moving, WRAD reveals how chaotic that motion is.
High Spectrum Width = more turbulence or mixing. Low values = smoother, more uniform motion.
Think of WRAD as your turbulence detector. It’s especially helpful in spotting:
- Rotating updrafts (like mesocyclones)
- Wind shear zones
- Inflow/outflow boundaries in strong thunderstorms
- Areas of storm growth or decay
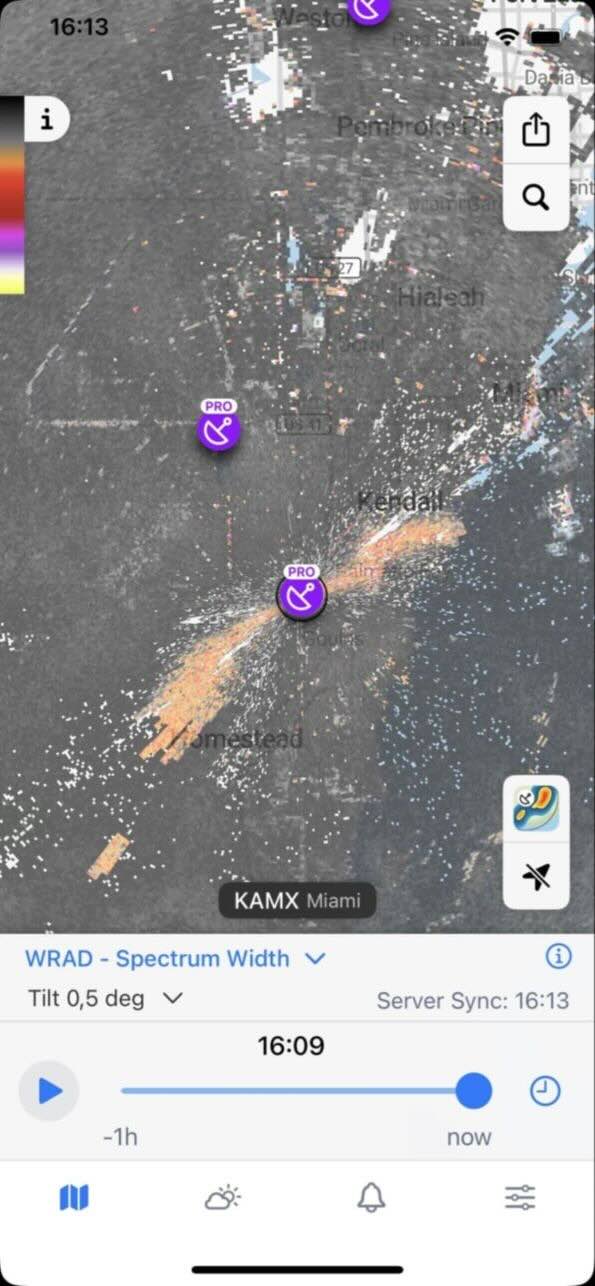
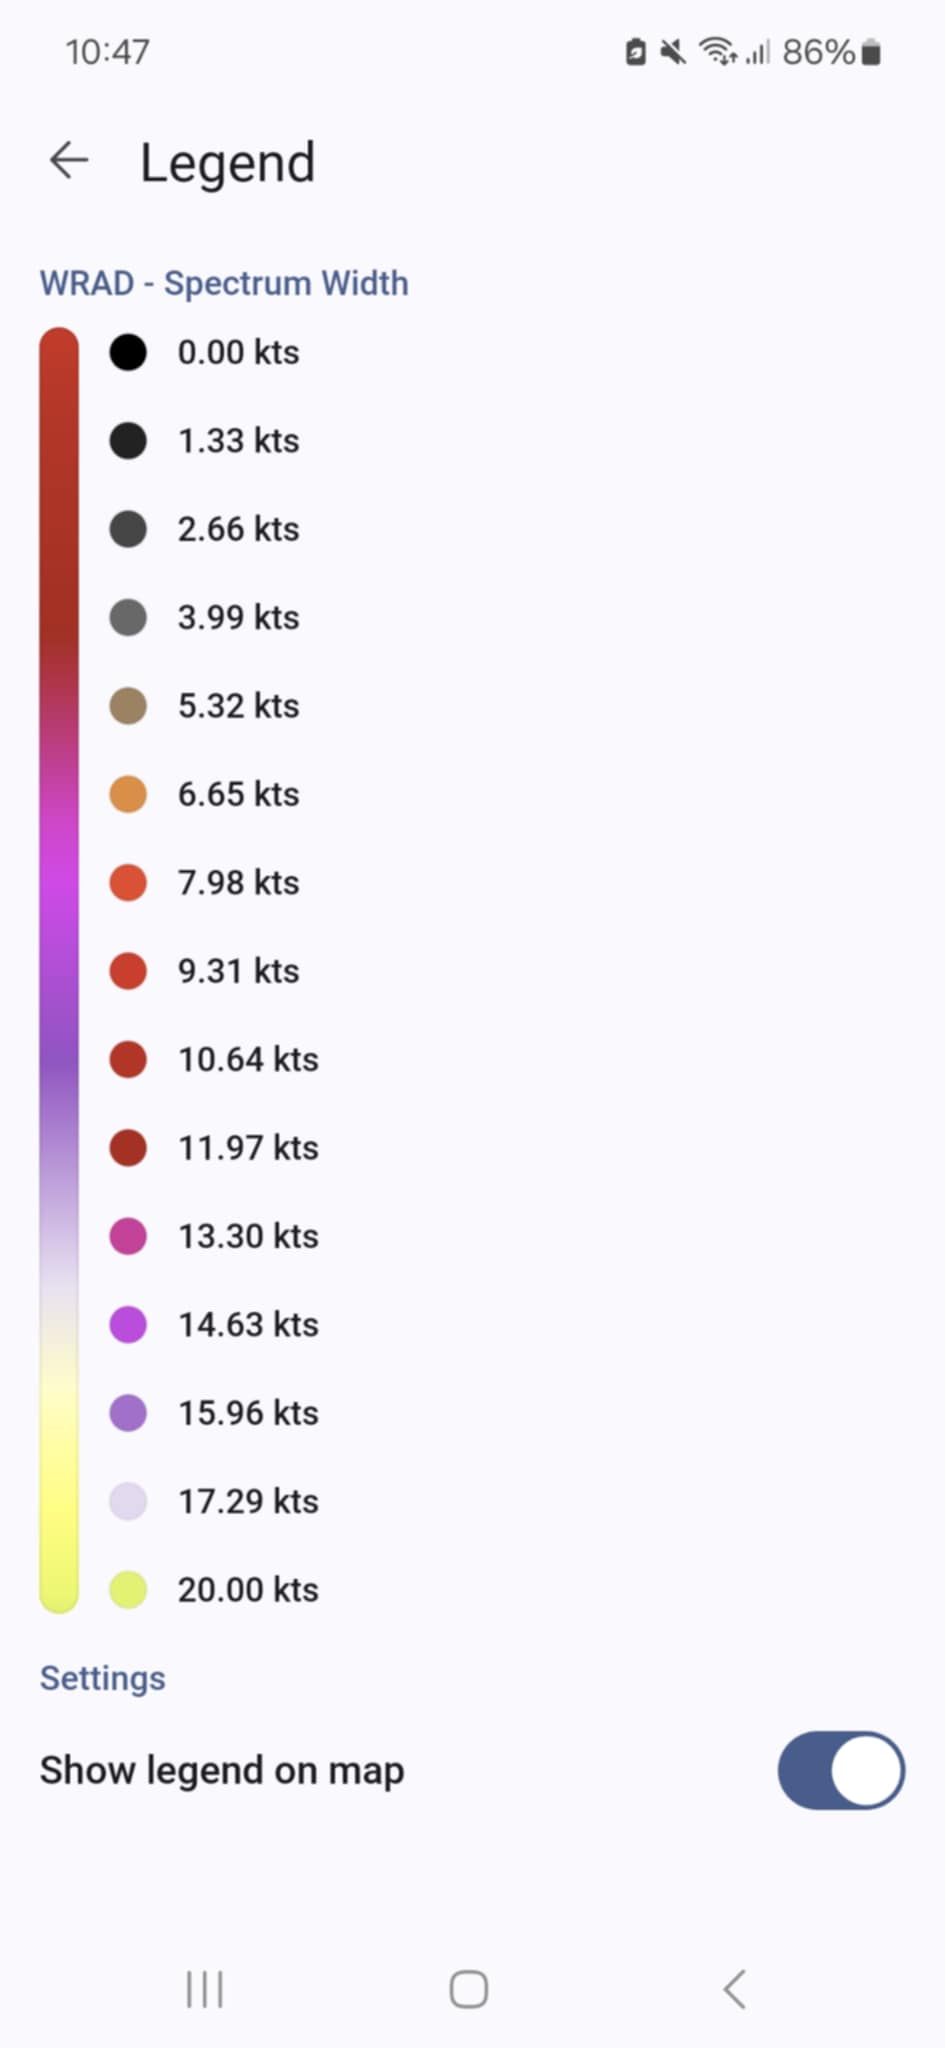
WRAD is measured in meters per second (m/s) and typically visualized in grayscale or color heatmaps, depending on the radar feed. The darker shades usually indicate calm, uniform motion, while brighter shades suggest active, varying speeds within the beam volume. For example, the scan above contains orange and white streaks extending SW-NE from Homestead through Kendall. These are zones of high spectrum width, which strongly suggest:
- Boundary-level turbulence
- Wind shear
- Possibly a gust front or outflow boundary
In some systems, WRAD may also be displayed in knots (kts), particularly in aviation or marine contexts. One knot equals approximately 0.514 meters per second, so understanding both units can help when comparing data across platforms.
How WRAD Works
Doppler radar emits pulses that bounce off hydrometeors (rain, snow, and hail). Spectrum Width looks at the statistical spread of returned velocities within a single radar sampling volume. If all the targets move uniformly, WRAD is low. But when speeds vary due to storm-scale rotation, gusty winds, or clashing air masses - WRAD spikes.
As a result, it can identify regions of turbulence or instability within a storm that other radar products might miss. However, it’s important to remember that elevated Spectrum Width values can also result from non-weather phenomena, such as ground clutter, birds, or interference. That’s why we recommend analyzing WRAD in tandem with other radar layers like Reflectivity and Velocity.
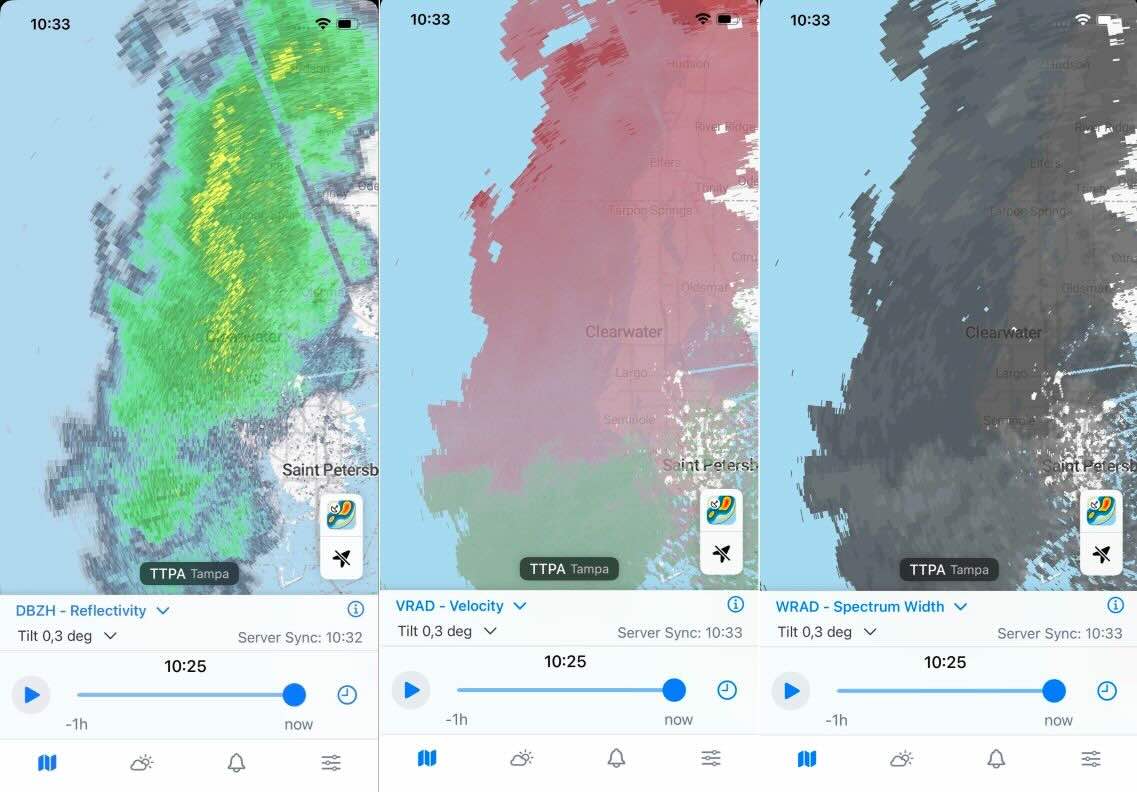
In the scan below, velocity shows that the wind is shifting dramatically at the coast. At the same time, spectrum width highlights the mixing zone where the air is turbulent. Not severe, but that’s a messy boundary that may bring gusty winds and sudden downpours.
Spectrum Width in RainViewer PRO
Inside the PRO Radar view, PRO users can choose Spectrum Width from the radar product menu. Features include:
- Near real-time updates (typically every 4-5 minutes for NEXRAD feeds)
- Tilt angle support that allows you to track turbulence across various elevations
- Dynamic color scales that help visualize subtle variations in motion
Pro Tips: How to Use WRAD Like a Storm Analyst
Whether you’re chasing storms or decoding radar from your living room, WRAD gives you a sharper, more nuanced view of storm dynamics:
Confirm Rotation
Seeing a tight couplet in Velocity? High WRAD in the same area increases confidence in active rotation. It’s a strong clue for potential tornadic developmen t, especially when paired with a drop in Correlation Coefficient.
Gauge Storm Strength
Broad WRAD zones at mid-levels can indicate vigorous updrafts. These are often a precursor to hail formation and can signal an intensifying storm.
Spot Wind Shear or Microbursts
Sudden WRAD spikes in low-level scans may indicate microbursts or sharp wind gradients - critical data for pilots, storm spotters, and emergency planners.
Identify Radar Noise
High WRAD values near the radar dome or in mountainous terrain might just be clutter. Always cross-reference with Reflectivity to determine if it’s meteorological or noise.
Track Mesoscale Features
WRAD can help outline features like gust fronts, dry lines, or outflow boundaries that are critical for storm initiation.
WRAD vs. Velocity: What’s the Difference?
While they both deal with motion, WRAD and Velocity serve distinct roles:
| Velocity | Spectrum Width (WRAD) | |
|---|---|---|
| What it shows | Mean motion of targets | Variability in motion |
| Best for | Tracking storm movement | Detecting turbulence |
| Common colors | Red/green | Grayscale or heatmap |
Velocity tells you the direction and speed of storm elements. WRAD adds context by showing how consistent that motion is. When used together, they create a more complete picture of what’s happening inside the storm.
Final Thoughts
WRAD might not get the spotlight like Reflectivity or Velocity, but it’s a powerhouse tool for those who want a deeper look at storm mechanics. It peels back the outer structure to show the messy, chaotic core of turbulence and shear.
Ready to level up your weather radar game? Head into RainViewer PRO and start exploring WRAD today. Use it to make smarter decisions, spot storm signatures faster, and deepen your weather expertise with every scan.