
Radar reflectivity is often the first thing users look at when analyzing weather radar maps . It shows where precipitation is falling and how intense it is. But reflectivity alone doesn’t reveal the full story, especially when it comes to wind. For weather enthusiasts eager to dive deeper, RainViewer PRO Radar unlocks another powerful layer of insight: radial velocity.
In this post, we explore two closely related radar products: VRAD and VRADH. Both are forms of radial velocity data and key tools for detecting rotation in storms, spotting wind shear, and analyzing airflow patterns in real time.
What Is Radial Velocity?
Before diving into the specific products, let’s clarify what “radial velocity” actually means.
Radial velocity refers to the component of wind speed that moves directly toward or away from a radar station. It’s measured using the Doppler effect: when a radar pulse bounces off precipitation particles, their motion changes the frequency of the returned signal. By analyzing this frequency shift, the radar can determine whether those particles are moving toward or away from it, and at what speed.
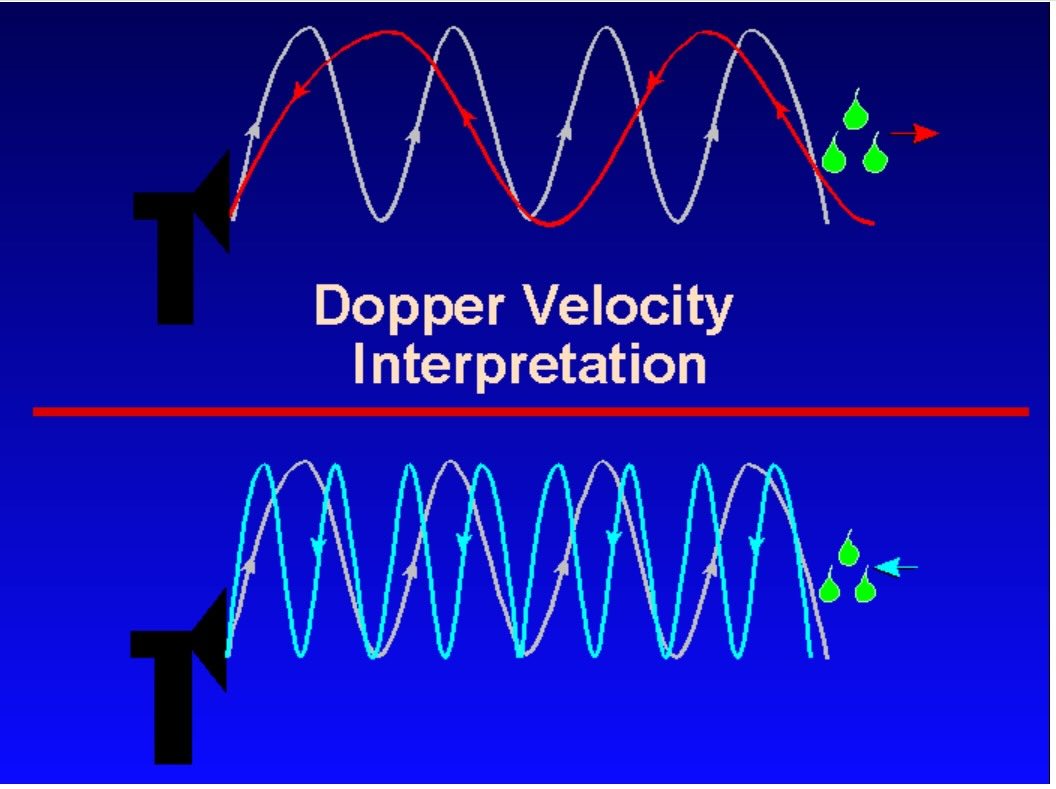
Source: NWS Milwaukee, erau.edu
This makes radial velocity one of the most essential tools in Doppler radar meteorology. Unlike reflectivity, which only shows where precipitation is occurring, radial velocity gives us a sense of the motion within a storm.
For example:
- Inbound velocities (winds moving toward the radar) are typically displayed in green or blue.
- Outbound velocities (winds moving away from the radar) are shown in red or pink.
Where these opposing motions are tightly packed together, meteorologists look for possible rotation - a signature of developing mesocyclones and potential tornadoes .
Where Can I Find Radial Velocity in RainViewer?
You can access radial velocity products in RainViewer’s PRO Radar layer. After you select a radar station marked with PRO, you’ll see a list of products available for this station. The velocity-related products are:
- VRAD: Raw radial velocity
- VRADH: Radial velocity at higher elevation
Let’s break down what each of these offers and how to use them effectively.
VRAD: Raw Radial Velocity
VRAD is the core radial velocity product. It displays the motion of hydrometeors (rain, snow, hail, etc.) directly toward or away from the radar. This data comes from the radar’s lowest elevation scan, typically around 0.5° above the horizon.
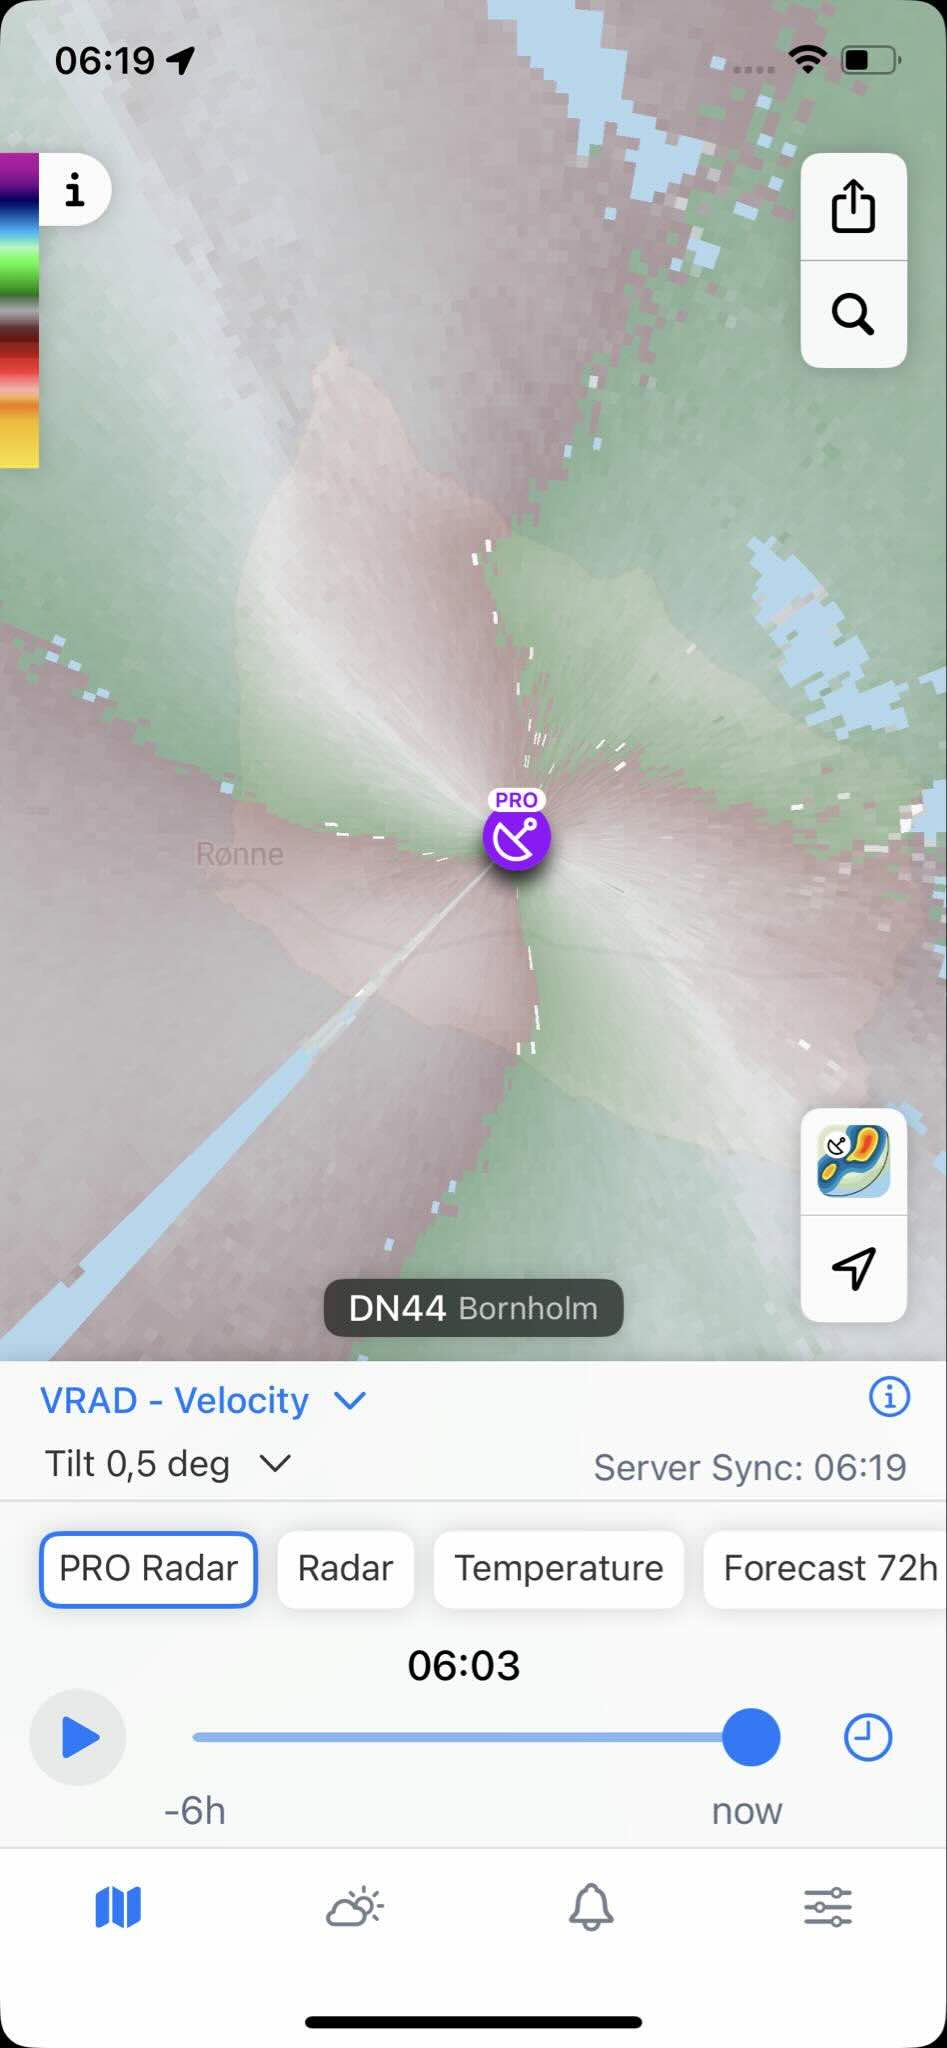
What You’ll See
- Close-up view of wind speed and direction near the surface (although actual beam height depends on distance from radar).
- Color-coded gradients showing inbound and outbound motion.
How to Read It
- Look for tightly packed gradients where red and green touch. These may indicate rotation, especially in supercells.
- Broad areas of consistent color can reveal outflow boundaries, gust fronts, or low-level jets.
- Strong greens or reds often indicate intense winds, which may pose severe weather hazards.
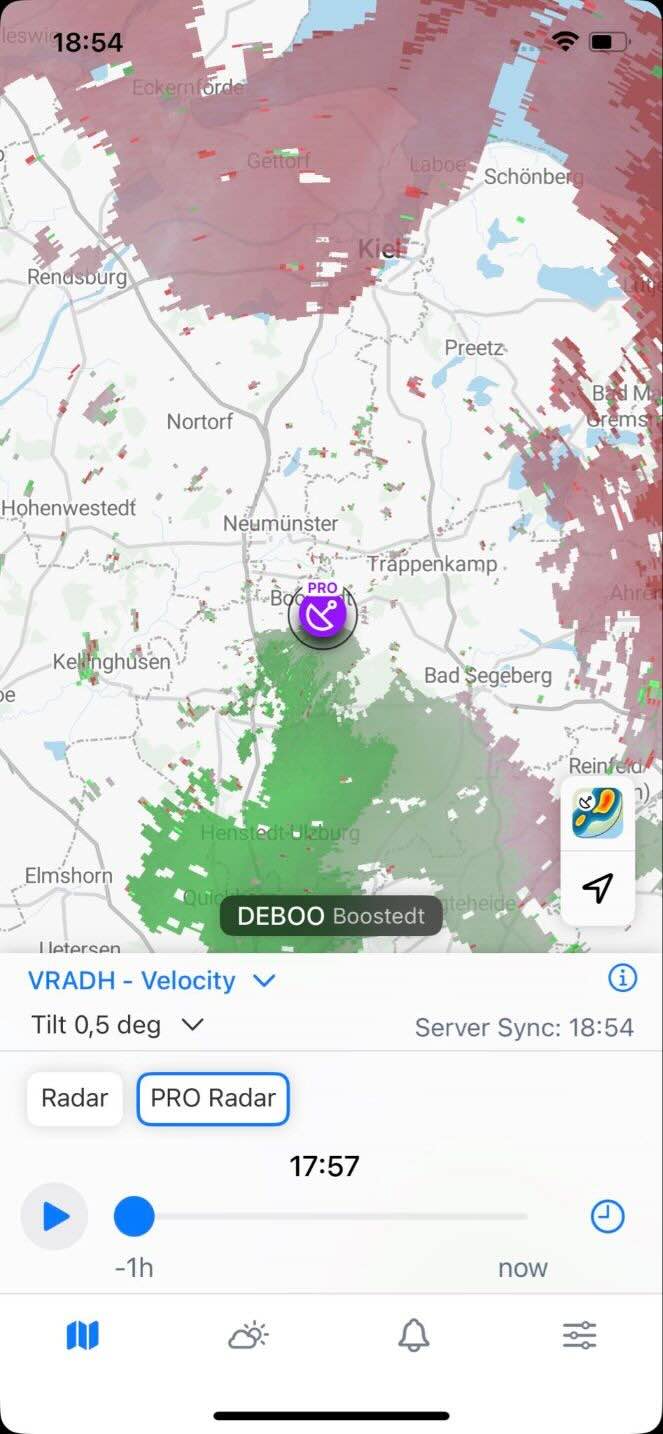
VRADH: High-Elevation Radial Velocity
VRADH offers the same kind of data as VRAD but from a higher elevation angle.
Why Use VRADH?
Storm dynamics vary with height. VRADH allows you to:
- Analyze mid-level rotation above the surface.
- Identify updrafts and divergence patterns higher in the storm column.
- Cross-reference with VRAD to confirm whether low-level rotation extends upward.
In the image below, there’s an area south of Neumünster (near Boostedt) where outbound (red) and inbound (green) winds are approaching each other. This could possibly indicate low-level convergence or broad inflow.
Limitation
Higher elevation scans cover a smaller area, especially at closer ranges. You’ll also be observing winds at higher altitudes, which may differ significantly from what’s happening at the surface.
Practical Tips for RainViewer Users
If you’re just starting out with velocity products, the learning curve can feel steep. But it’s worth it. Here are a few tips for integrating VRAD and VRADH into your radar-watching routine:
1. Always Cross-Reference Reflectivity
Velocity tells you how winds are moving, but it doesn’t show precipitation intensity or type. Use reflectivity alongside radial velocity to understand the full structure of a storm.
2. Look for Couplet Patterns
A classic sign of rotation is a couplet: red (outbound) next to green (inbound). The tighter the gradient, the stronger the rotation. Track how these features evolve over time - do they tighten, broaden, or move?
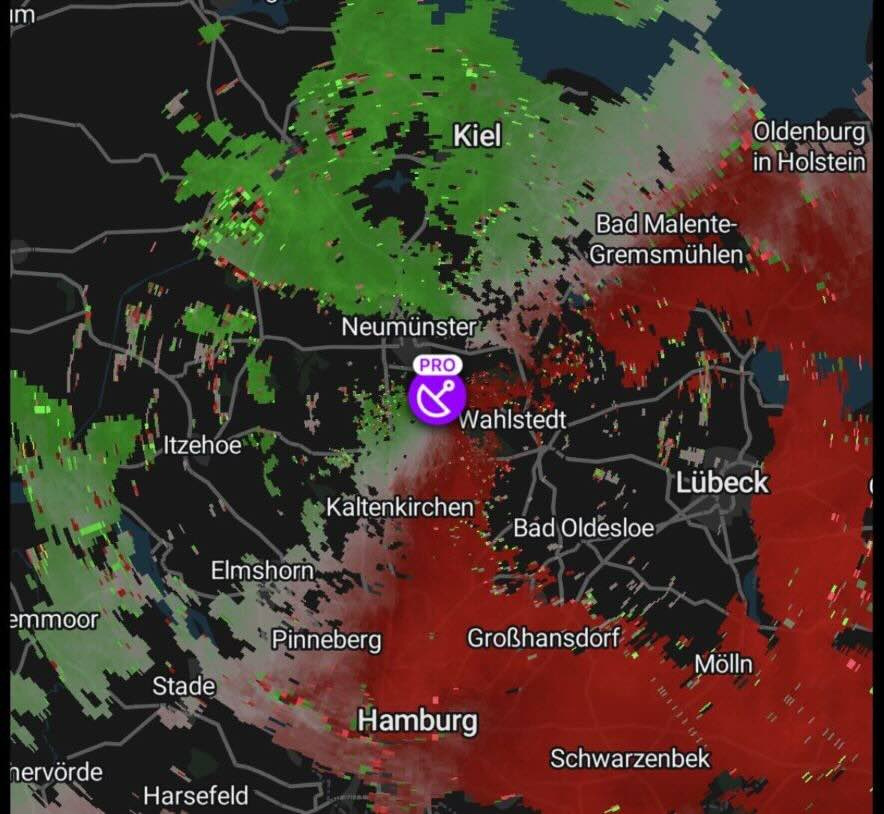
For example, in a central portion of the scan in the image below, there’s a clear area where greens and reds are right next to each other. That’s often a signature of rotation - potentially a mesocyclone.
Why Radial Velocity Matters
Radial velocity products aren’t just “nice to have”. They’re essential for understanding the inner workings of storms. Here’s what you can do with them:
- Spot tornado potential before touchdowns occur.
- Track squall lines and identify where damaging winds may develop.
- Analyze storm outflows, microbursts , and mesoscale boundaries.
- Compare tilt levels to understand storm structure and growth.
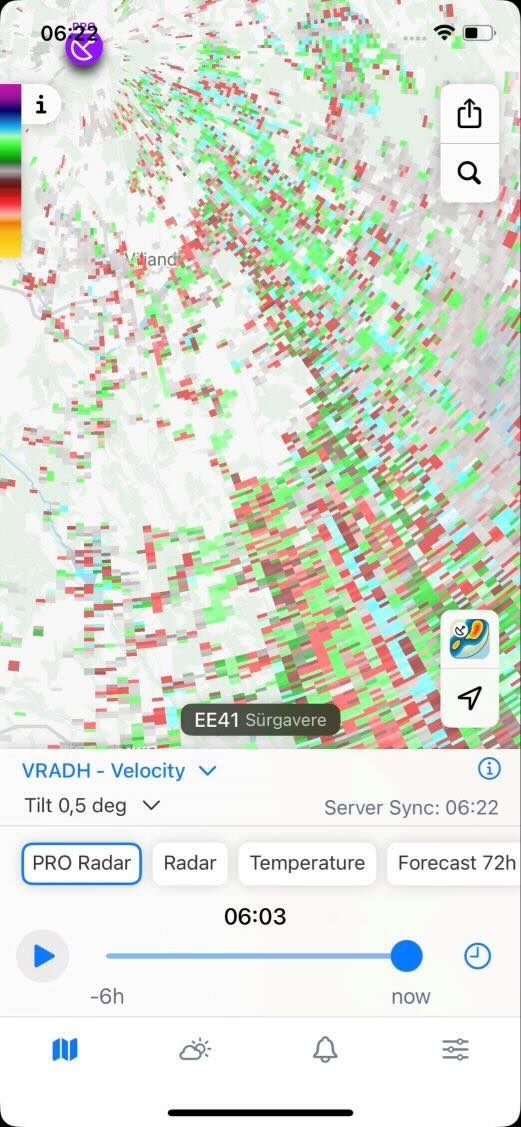
Take a look at the scan below. There’s a mess of alternating green/red pixels, suggesting:
- Moderate turbulence or shear
- Possibly outflow boundaries or low-level wind shift zones
- No organized rotation, but some localized pockets of speed changes
This kind of scan is super helpful for:
- Spotting microbursts
- Tracking boundary collisions
- Watching for rotation “seeds” in convective environments
Final Thoughts
VRAD and VRADH offer a unique perspective on wind motion. Together, they create a multi-dimensional view of storm dynamics, transforming the way you see the sky.
So next time a storm brews near your area, don’t just watch the reflectivity. Open up the velocity layers. Study the couplets. Compare the tilts. Test your interpretation skills. The more you dig in, the more intuitive it becomes.
And if you ever spot something compelling - share it with the RainViewer community. Every observation is a chance to learn, compare notes, and improve our collective forecasting game.